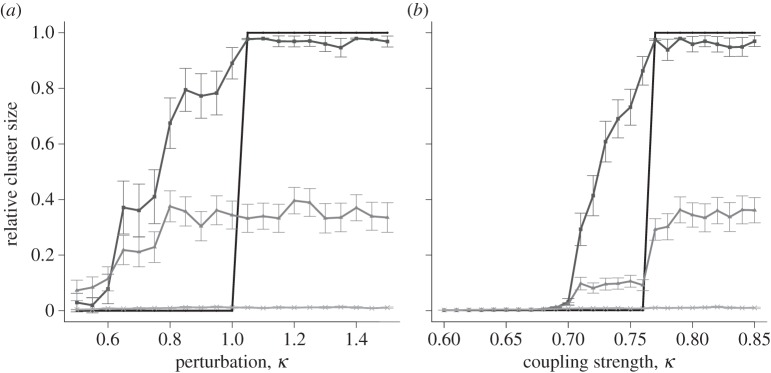
Figure 6.

Relative cluster size versus small changes in parameters. Points show mean ± s.e.m. of 100 simulations, for a lattice size of 25 × 25. The four lines represent probabilities of connections between cells of 1, 0.7, 0.5 and 0.3 on a graded scale from dark to light. Anomalous cluster sizes are too few to affect the average. (a) Fixed coupling value κmax = 5.12 with varying perturbation; (b) fixed initial perturbation = 1.0 with varying coupling values around κmin = 0.76.
