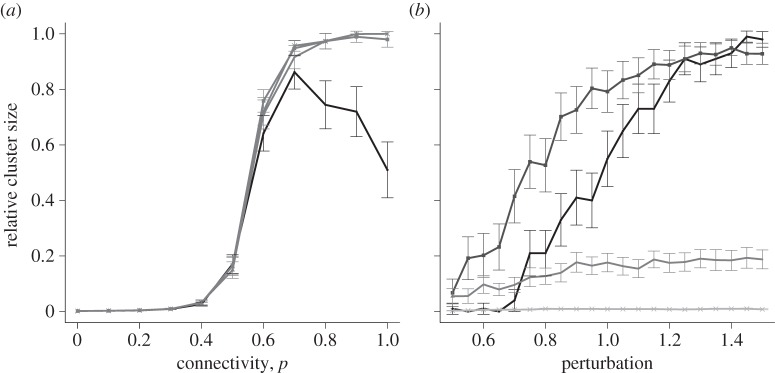
Figure 7.

(a) Relative cluster size versus connectivity, for random coupling values. All points show mean ± s.e.m. of 100 simulations, for an isotropic lattice of size 25 × 25. The four lines represent initial perturbations of 1, 1.5, 2 and 2.5. A perturbation of 1 is shown in the darkest shade. Lighter colours represent perturbations of 1.5, 2 and 2.5 due to their close proximity. All κ ∈ [0.5,10]. (b) Relative cluster size versus perturbation, for an isotropic square lattice of size 25 × 25. All κ ∈ [0.5,10]. Points show mean ± s.e.m. of 100 simulations. The four lines represent probabilities of connections between cells of 1.0, 0.7, 0.5 and 0.3 on a graded scale from dark to light. Anomalous cluster sizes are too few to affect the average.
