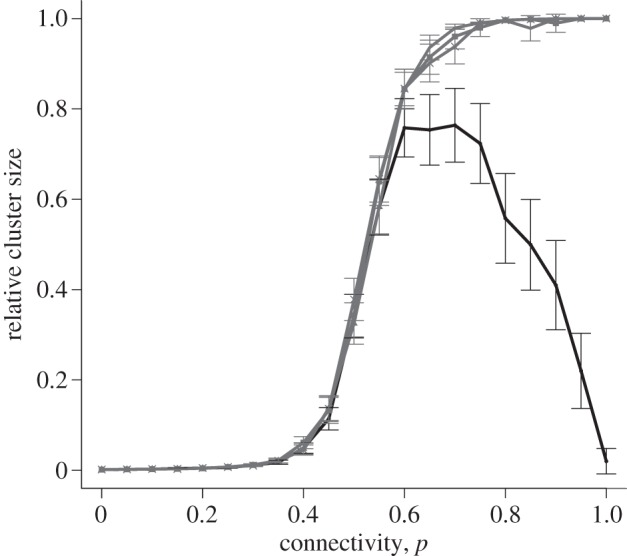
Figure 9.

Relative cluster size versus connectivity, for a selection of initial perturbations. All points show mean ± s.e.m. of 100 simulations, for an asymmetrically coupled lattice of size 25 × 25. The four lines represent initial perturbations of 1, 1.5, 2 and 2.5. Perturbations of 1 are shown in the darkest shade, and the remaining perturbations are shown lighter due to their close proximity. Capacitance values are sampled from 18-day distribution. There is no discernible difference in the model using capacitance values sampled from 15-day distribution.
