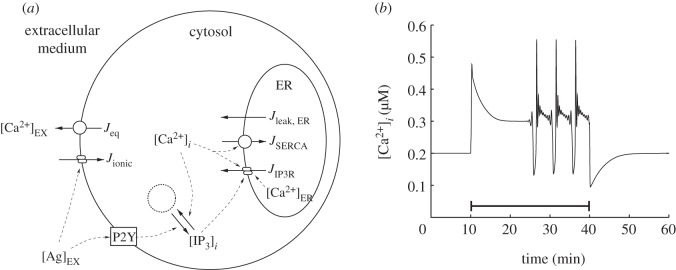
Figure 1.

The cell model and an example calcium transient. (a) Diagram of the whole cell calcium signalling model. The model describes the evolution of extracellular, cytosolic and ER calcium concentrations. Leak currents between these compartments are represented by straight arrows, pumped currents by arrows overlayed with circles, and channel currents by arrows overlayed with two ellipses. The square represents the P2Y receptors that are activated by the external agonist and drive IP3 production from an inexhaustible pool of intracellular resources, indicated by the dotted circle. Dashed lines indicate couplings between the various components of the model. (b) An example calcium transient produced by the model with an extracellular calcium concentration of 2 mM using the parameter set in the electronic supplementary material, table S1. Agonist (25 μM) is applied at t = 10 min and removed at t = 40 min, as indicated by the solid line.
