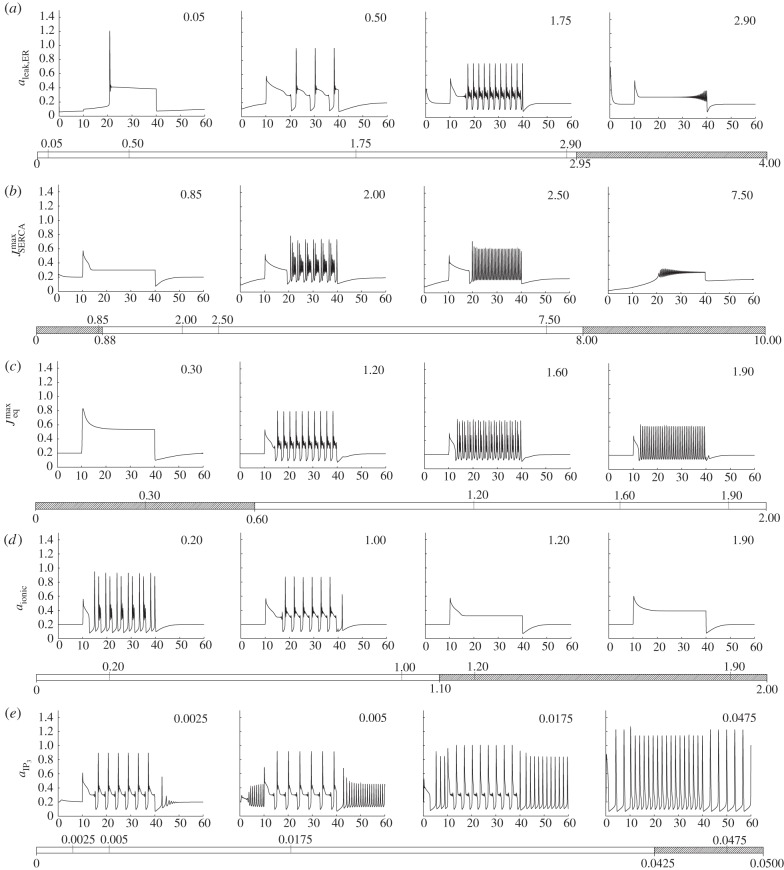
Figure 2.
The model contains a total of 18 parameters, nine of which we expect to vary significantly from cell to cell. Here, we show a one-at-a-time robustness analysis of the first five of these parameters. From (a–e), these are aleak,ER,  ,
,  , aionic and
  . Each plot shows the cytosolic calcium concentration (vertical axis, μM) as a function of time (horizontal axis, minutes), and each row shows how the transient changes as one of these parameters is varied. In each case, four example plots are shown corresponding to the upward ticks on the bar below the plot, which also indicates the range of each parameter expressed in units of the default values given in the electronic supplementary material, table S1 (with the exception of aIP3, which uses absolute values). The shaded areas of the bars correspond to parameter regimes that produce qualitatively different calcium transients compared with the baseline case, with the transitions between them indicated by the downward ticks.

