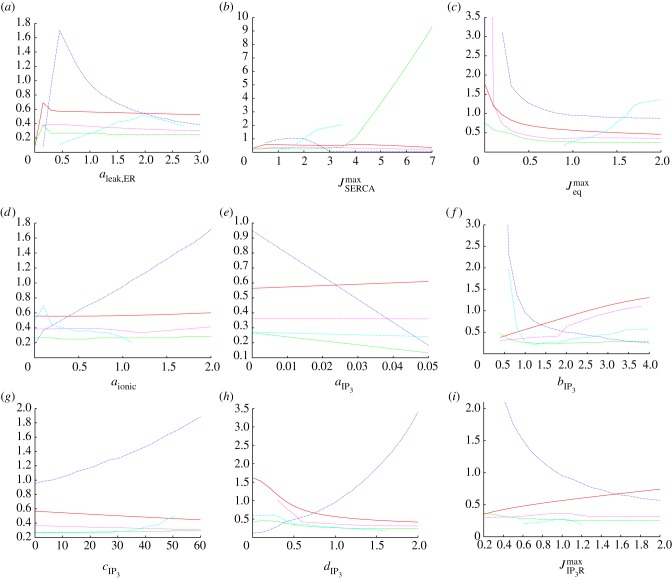
Figure 4.
One-at-a-time robustness analysis for the nine parameters (a–i) examined in figures 2 and 3 using the transient classifier described in the electronic supplementary material. Each plot shows the magnitude (solid line, vertical scale in mM) and time (long dashed line, min) of the initial peak, the time taken for the calcium to fall to 80% of this initial peak (short dashed line, min), the magnitude of the subsequent plateau (dotted line, mM) and the rate of spiking or bursting that follows (dot-dashed line, events per minute). These five quantities capture the key features of the calcium transient. (Online version in colour.)

