
Figure 2.
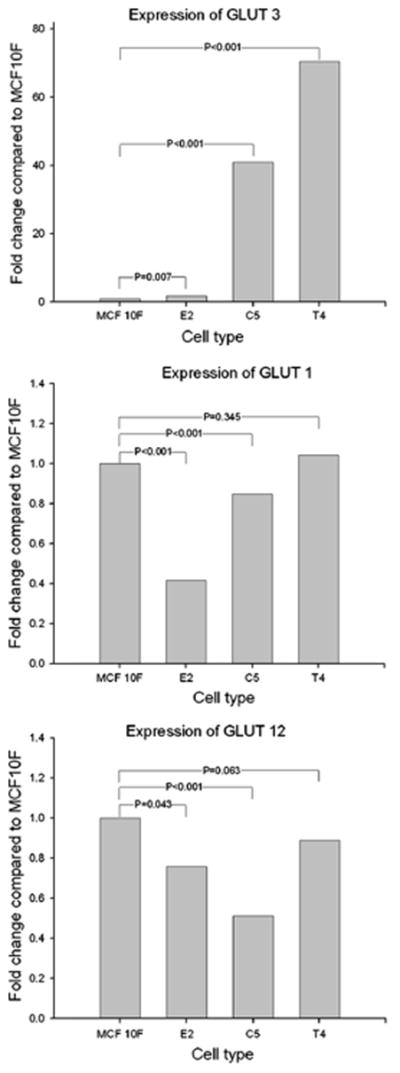
Graphics showing the expression of each gene (Glut3, Glut1 and Glut12), for each cell type (E2, C5, T4). The expression is shown in fold change related to MCF10F cells
Official websites use .gov
A
.gov website belongs to an official
government organization in the United States.
Secure .gov websites use HTTPS
A lock (
) or https:// means you've safely
connected to the .gov website. Share sensitive
information only on official, secure websites.
Graphics showing the expression of each gene (Glut3, Glut1 and Glut12), for each cell type (E2, C5, T4). The expression is shown in fold change related to MCF10F cells