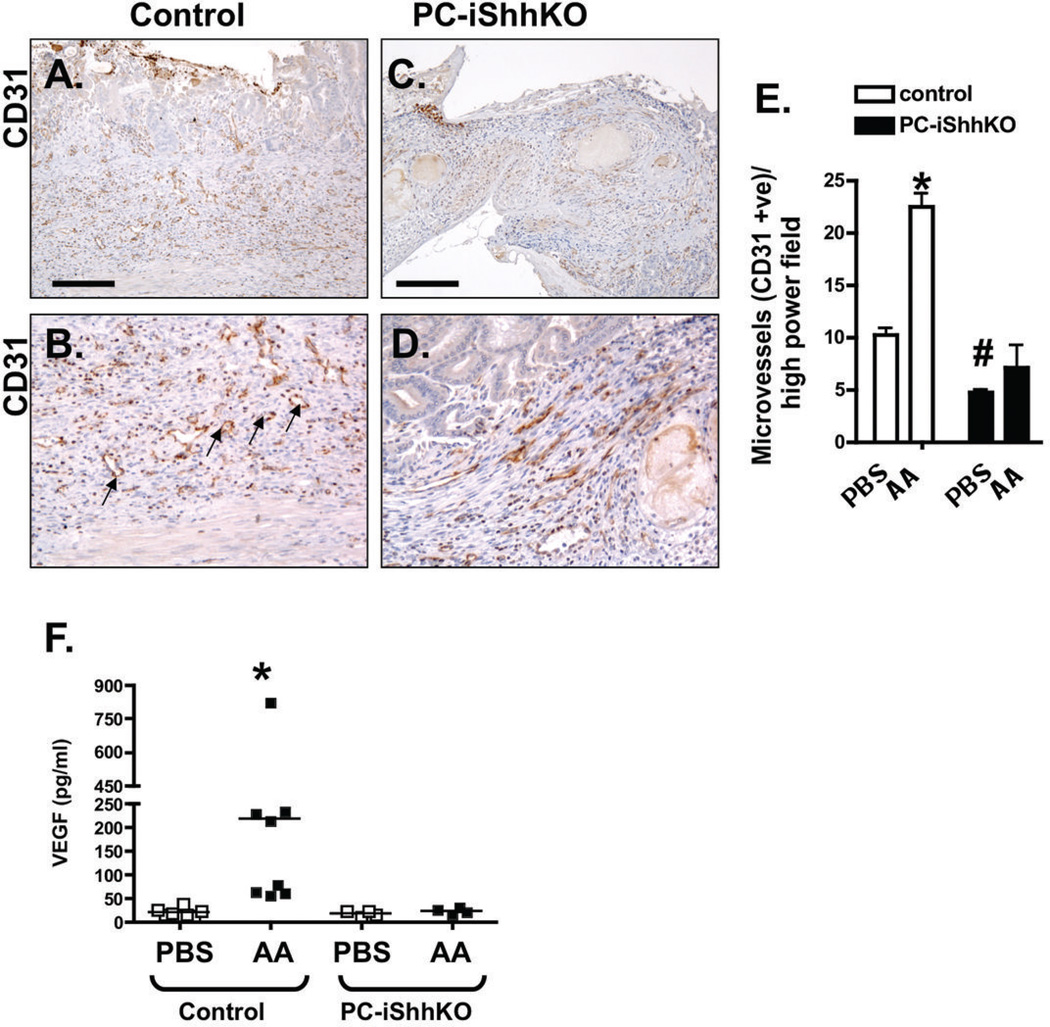
Figure 9. Expression of CD31 and VEGF in control and PC-iShhKO mouse stomachs during wound healing.
Immunostaining for CD31 of stomach sections collected from (A, B) control and (C, D) PC-iShhKO mice 7 days after acetic acid ulcer induction. Images were captured at 20X magnification. Higher magnification images shown in B and D were captured at 40X magnification. Scale bars = 150 microns. Representative figures of n = 6–8 mice per group. (E) Microvessels were counted in PBS- and acetic acid (AA)-treated control and PC-iShhKO mice 7 days after induction of ulcers. Data is shown as mean + SEM. *P<0.05 compared to PBS-treated control, #P<0.05 compared to PBS-treated PC-iShhKO mice. n = 3–4 mice/group. (F) VEGF tissue concentrations measured in control and PC-iShhKO mouse stomachs. N = 5–6 mice per group, *P < 0.05 compared to PBS controls.

