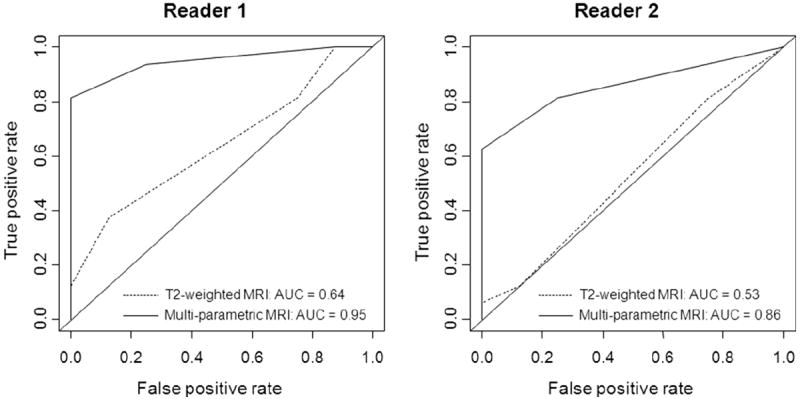
Figure 2.

Graphs show ROC curves and AUCs for each reader as a measure of accuracy for qualitative assessment in detecting locally recurrent prostate cancer after radiation treatment at both the patient level (2a) and the prostate-side level (2b). (Note: reader 1 was an experienced radiologist, whereas reader 2 was less experienced).
