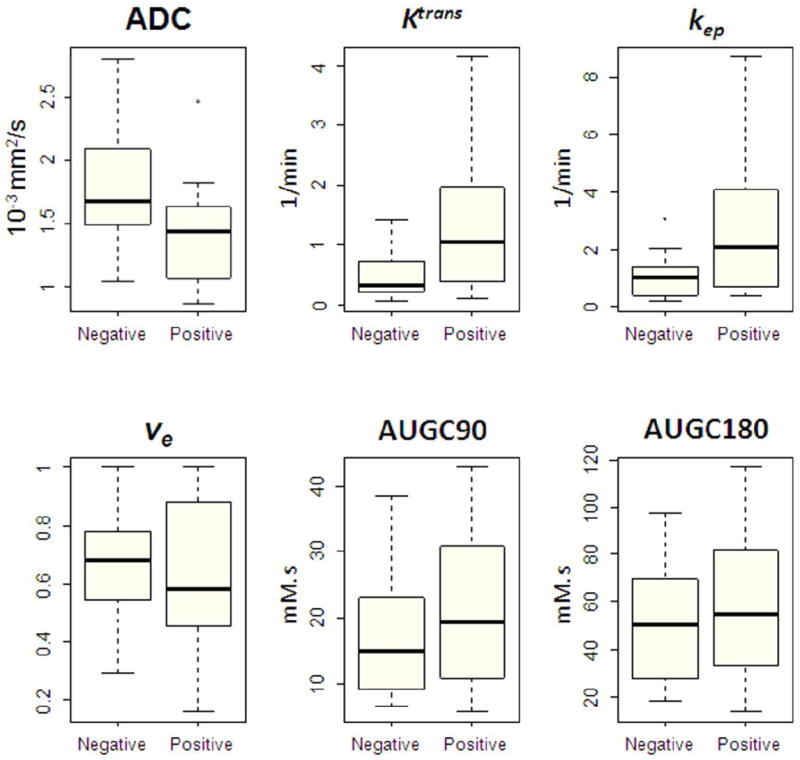
Figure 3.

Box-and-whisker plots illustrate quantitative MRI parameters for biopsy-negative and biopsy-positive prostate sides. (Note: The boxes represent the values from the lower to the upper quartile; the horizontal line inside each box indicates the median; the horizontal lines outside each box indicate the minimum and maximum values; and the dots indicate outlying values).
