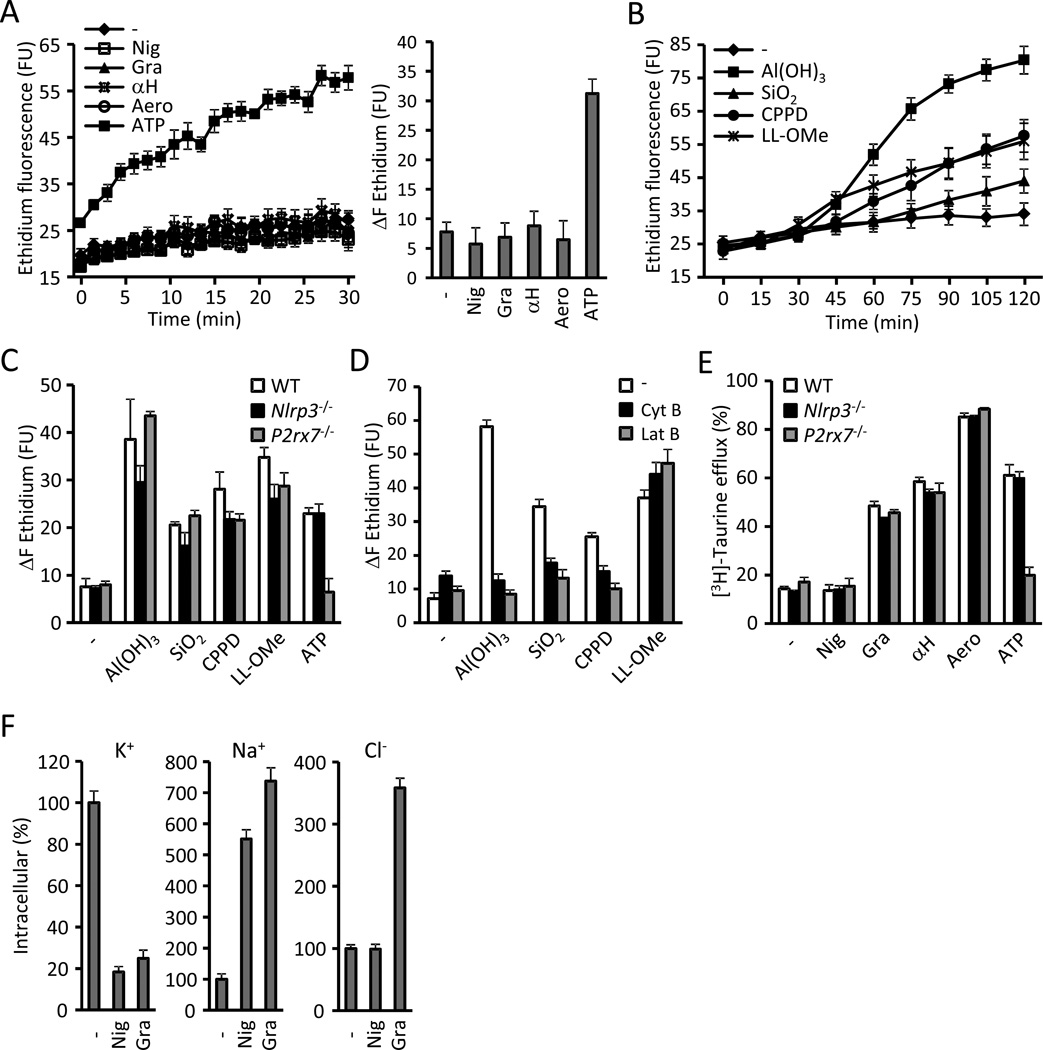
Figure 5. NLRP3 activation correlates with K+ efflux and Na+ influx but not with the opening of a nonselective pore.
(A) Ethidium uptake kinetics in BMDMs treated with 10 µM nigericin (Nig), 0.5 µM gramicidin (Gra), 10 µg/ml S. aureus α-hemolysin (αH), 10 ng/ml A. hydrophila aerolysin (Aero) or 5 mM ATP. The total increase of ethidium fluorescence during the stimulation (ΔF ethidium) is shown in the right panel. (B) Ethidium uptake kinetics in BMDMs treated with 250 µg/ml of Al(OH)3, silica (SiO2) or calcium pyrophosphate crystals (CPPD) or with 1 mM L-leucyl-L-leucine methyl ester (LL-OMe) for 2 hrs. (C) WT, Nlrp3−/− and P2rx7−/− BMDMs were stimulated for 2 hrs with 250 µg/ml of Al(OH)3, silica (SiO2), CPPD crystals and 1 mM LL-OMe and the ethidium uptake was quantitated. ATP (5 mM, 30 min) was used as a control for P2rx7 signaling. (D) Ethidium uptake by BMDMs stimulated for 2 hrs with 250 µg/ml Al(OH)3, silica (SiO2), CPPD crystals and 1 mM LL-OMe in the presence of phagocytosis inhibitors cytochalasin B (5 µM, Cyt B) and latrunculin B (200 nM, Lat B). (E) [3H]-taurine efflux was determined in WT, Nlrp3−/− and P2rx7−/− BMDMs treated 30 min with 10 µM nigericin (Nig), 0.5 µM gramicidin (Gra), 10 µg/ml S. aureus α-hemolysin (αH), 10 ng/ml A. hydrophila aerolysin (Aero) or 5 mM ATP. (F) The intracellular content of K+, Na+ and Cl was determined in BMDMs treated 30 min with 10 µM nigericin (Nig) or 0.5 µM gramicidin (Gra). Na+ and K+ were measured by ICP-OES and Cl− by ICP-MS in Nlrp3−/− cells. Values represent mean ± standard deviation (n=3). Results are representative of at least three separate experiments. FU, fluorescence units. See also Figure S3.

