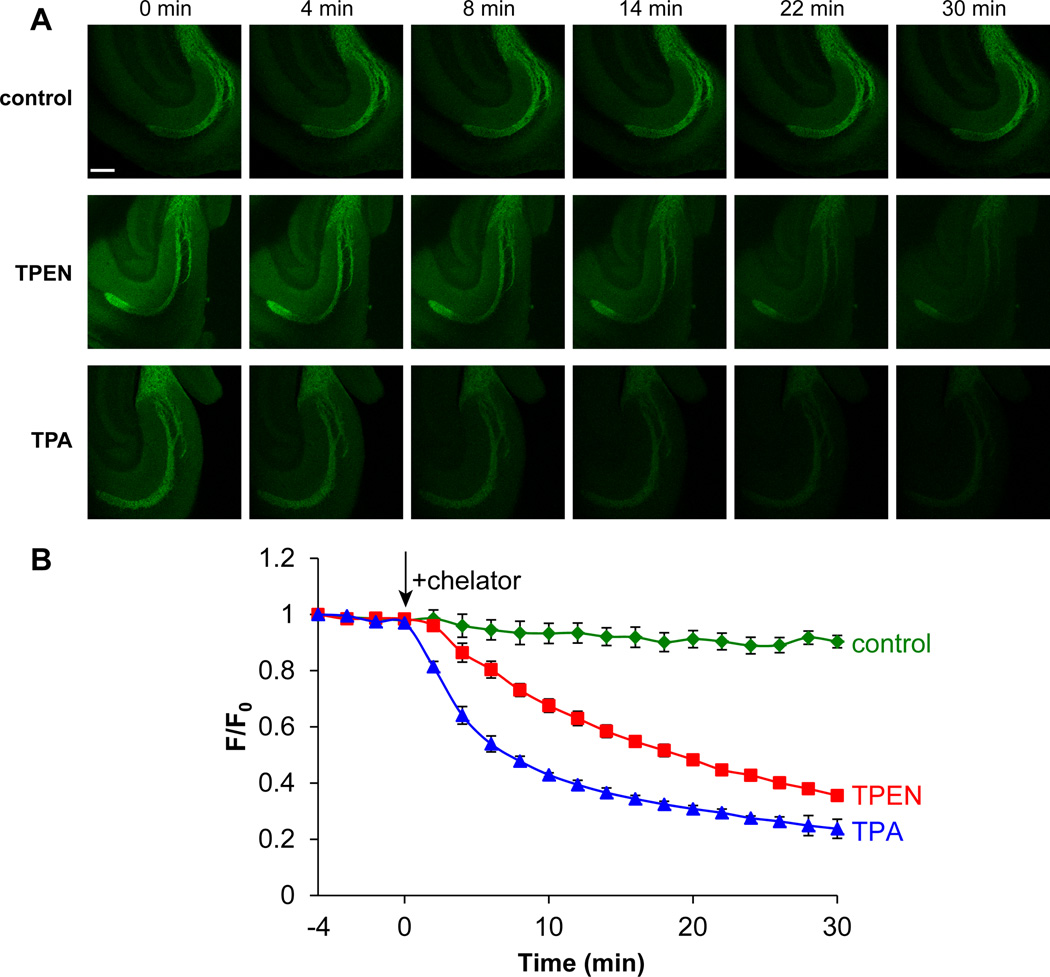
Fig. 5.
(A) Selected images of acute hippocampal slices recorded with two-photon microscopy after treatment with blank ACSF media (control) or with 100 µM TPEN or TPA. Chelators were introduced at t = 0 min. Scale bar = 200 µm. (B) Normalized fluorescence intensities vs. time. n = 3 (control), 4 (TPEN) and 4 (TPA). Error bars represent standard errors of the mean.

