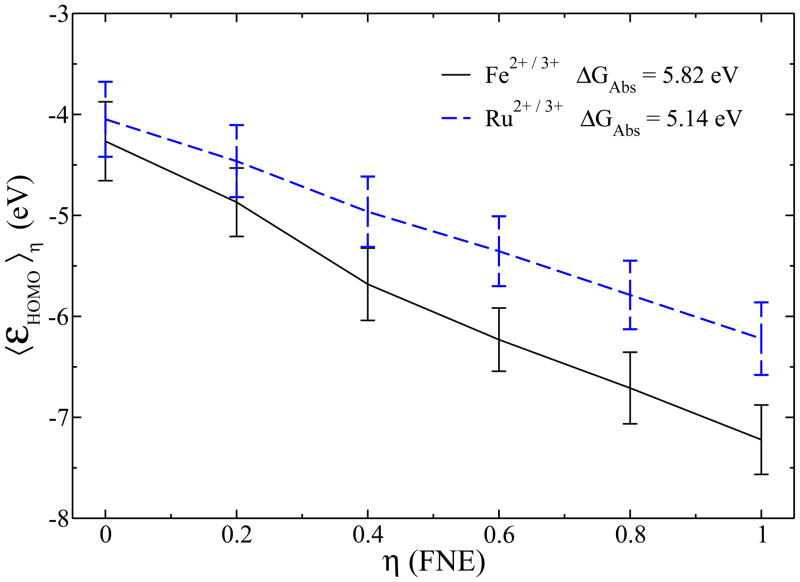
Figure 3.
Ensemble average of εHOMO curves for the two test systems at different fractional numbers of electrons. Their oxidation free energies are annotated, respectively, according to Eq. (10). The vertical bars indicate thermodynamic fluctuations.

