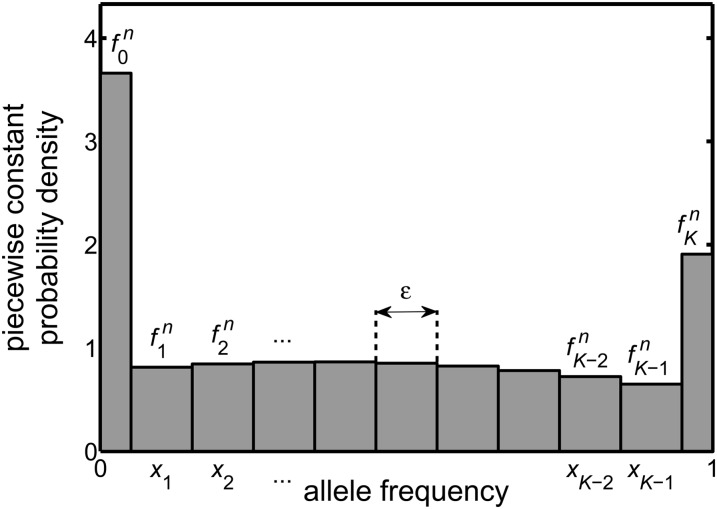
Figure 1.
The numerical approximation replaces the exact probability density of the diffusion equation at time tn, namely f(x, tn), by the approximate piecewise constant probability density shown in the figure. This approximate distribution is determined by discretizing, averaging, and approximating the equation obeyed by f(x, t) and then iterating the resulting equation. It leads to the quantities , each of which is a numerical approximation of the average value of f(x, tn), with the average taken over a range of x near the grid point xi (see Interpretation of the numerical scheme). The numerical scheme is designed so that the total probability of the approximate distribution takes the value of unity for all values of the time index, n. The piecewise constant probability density in the figure is an actual output of the numerical method where the following apply. The type of selection acting is genic [hence M(x) = sx(1 − x)] and is of strength s = 0.02, the effective population size is Ne = 10, the initial frequency is 0.4, the time step is τ = 0.01, the number of control volumes is K = 10, and hence the spacing of the frequency grid is ε = 1/K = 0.1. The distribution shown has been evolved for n = 1200 time steps of the numerical scheme, i.e., 12 generations.

