
Figure 3.
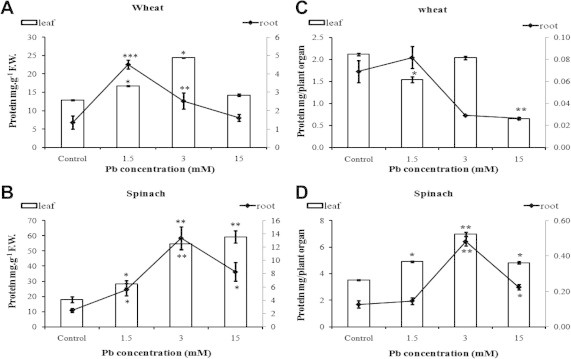
Effect of lead on soluble protein concentrations in wheat (A) and spinach (B) and on total amount of soluble protein in wheat (C) and spinach (D) seedlings. Results are the mean of five replicates ± SD. ∗Asterisks indicate significant differences between the treatments and the control of the same plant species (∗p < 0.05; ∗∗p < 0.01; ∗∗∗p < 0.001).