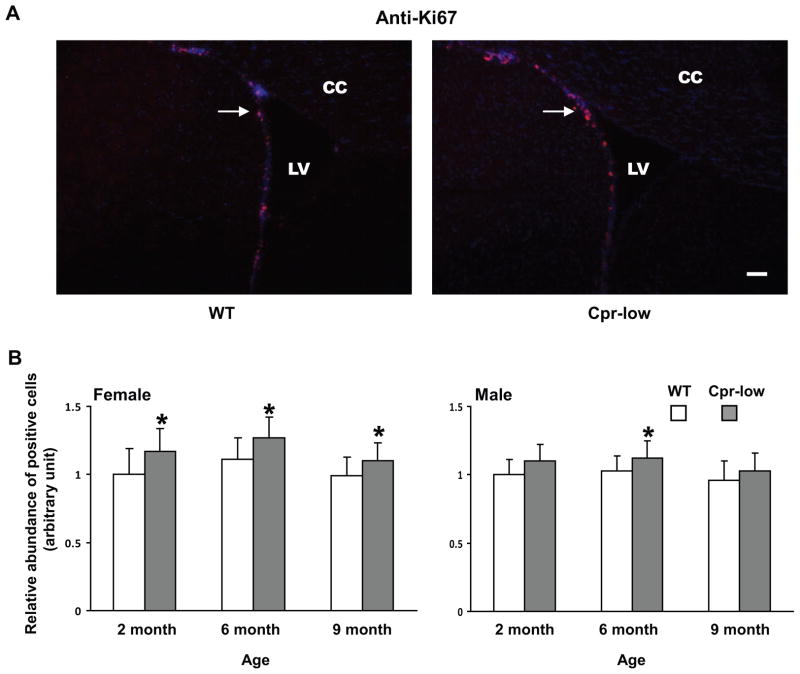
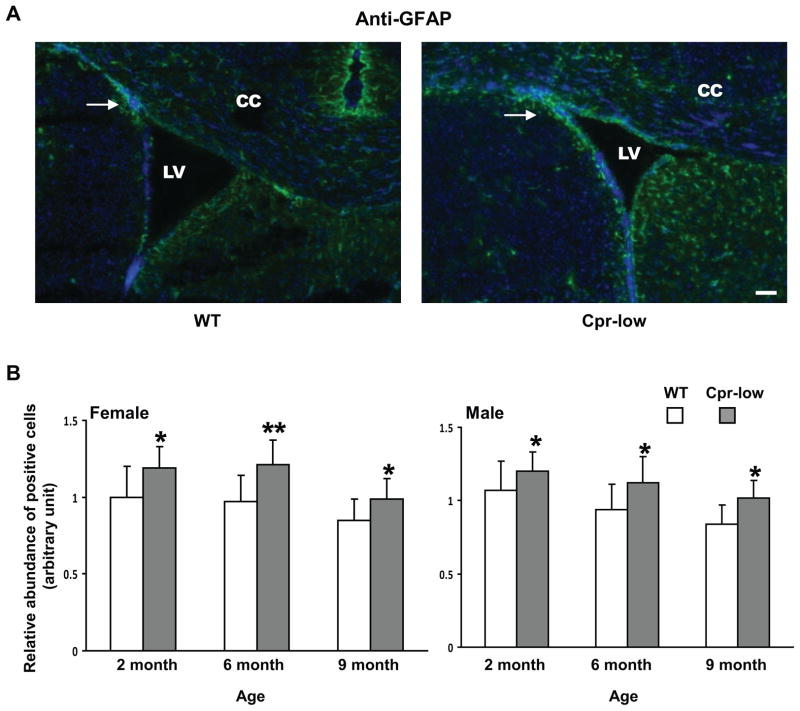
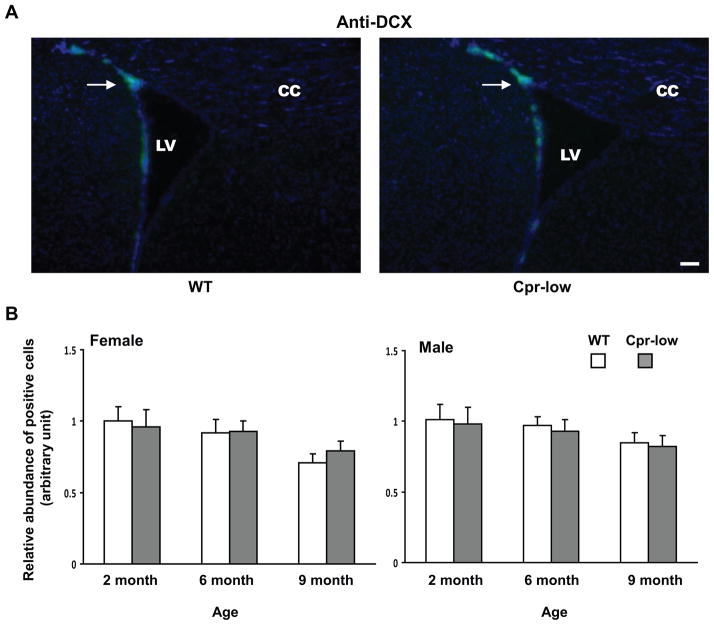
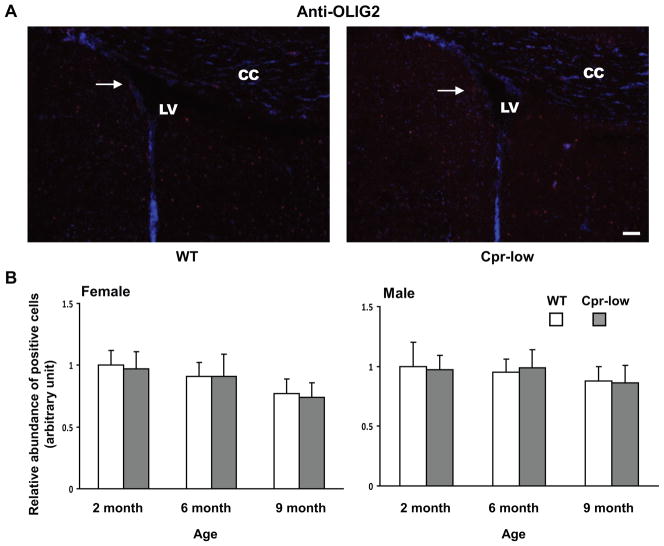
Fig. 1. Abundances of cells positive for Ki67, GFAP, DCX or OLIG2 in the SVZ of Cpr-low and WT mice at various ages.
Adult Cpr-low and WT mice (three mice per age or sex group) were studied. Coronal sections covering the SVZ region from each mouse brain were analyzed by IHC for Ki67 (Fig. 1--1, positive (proliferating) cells in red), GFAP (Fig. 1-2, positive cells (astrocytes) in green), DCX (Fig. 1-3, positive cells (immature neurons) in dark blue), OLIG2 (Fig. 1-4, positive cells (oligodendrocytes) in red). A. Representative IHC images. Images shown are for female mice at 6 months of age. All sections were counter-stained with DAPI. Examples of positive cells in the SVZ are indicated by arrows. Scale bar, 100 μm. LV, lateral ventricle; CC, corpus callosum. B. Quantitative analysis of the abundance of positive cells in each group. The values reported are means ± S.D. for three mice per group (n=3); for each mouse, the result was based on the averaged value from five separate slides, each containing both right and left SVZ. For Ki67, GFAP, and OLIG2, positive cells were counted manually, and the results are shown as relative abundance (in arbitrary units), with the mean (averaged) number of positive cells in 2-month-old male or female WT mice (which were 87, 84, and 140 for males, and 84, 82, and 137 for females, for Ki67, GFAP, and OLIG2, respectively) set as 1. For DCX, areas containing positive cells were integrated as described in Methods and the results are shown as relative abundance (in arbitrary units), with the mean value in 2-month-old male or female WT mice (36729 for females and 37731 for males) set as 1. *, P<0.05; **, P<0.01; Cpr-low vs WT mice (two-way ANOVA).


