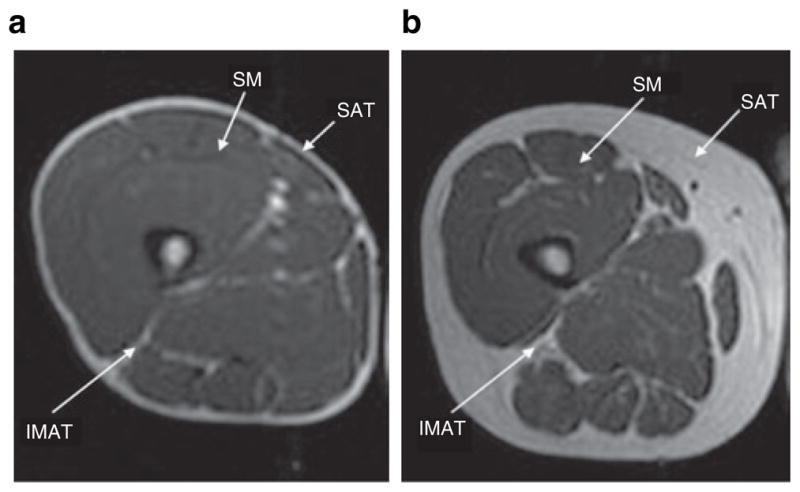
Figure 1.

MRI slice image comparing IMAT, SAT, SM by HIV status. Axial MRI, at the level of mid-thigh. (a) An HIV-infected male, showing decreased subcutaneous and intermuscular fat. (b) An uninfected, control male, showing normal amounts of subcutaneous and intermuscular fat. Both participants have a BMI of 25. HIV, human immunodeficiency virus; IMAT, intermuscular adipose tissue; MRI, magnetic resonance imaging; SAT, subcutaneous adipose tissue; SM, skeletal muscle.
