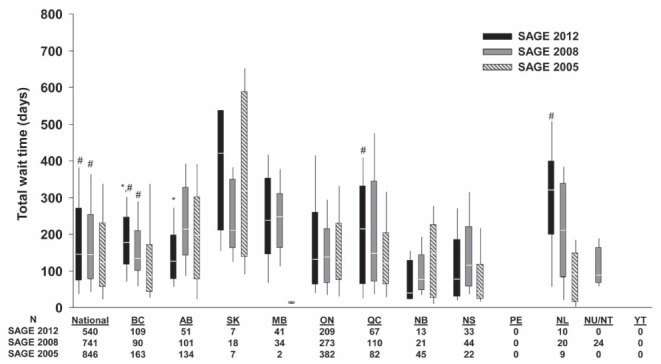
Figure 2.

Box-and-whisker plot of total wait times according to province. Wilcoxon rank-sum test with multiple comparison adjustment. Box = median and 25th to 75th percentiles, whisker bar = 10th to 90th percentiles. *P<0.05 versus 2008;#P<0.05 versus 2005. AB Alberta; BC British Columbia; MB Manitoba; NB New Brunswick; NL Newfoundland and Labrador; NS Nova Scotia; ON Ontario; PE Prince Edward Island; QC Quebec; NU/NT Nunavut/Northwest Territories; SAGE Survey of Access to GastroEnterology; SK Saskatchewan; YT Yukon
