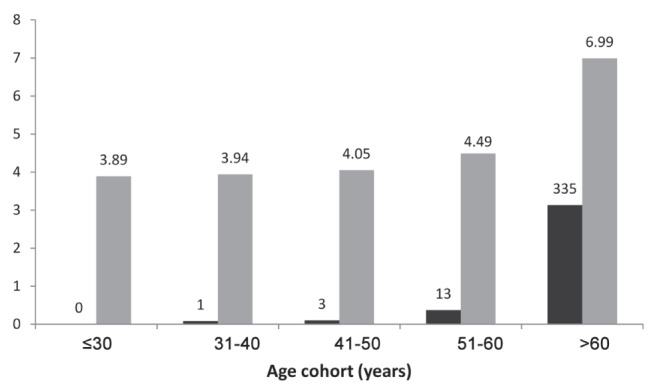
Figure 3.

Mortality rate and length of stay in each age cohort. Black bars display the number of deaths in each group as a percent of total with raw numbers appearing above individual bars. Grey bars (with accompanying numbers) show the mean length of stay during their first hospitalization for patients in each age group who did not undergo colectomy
