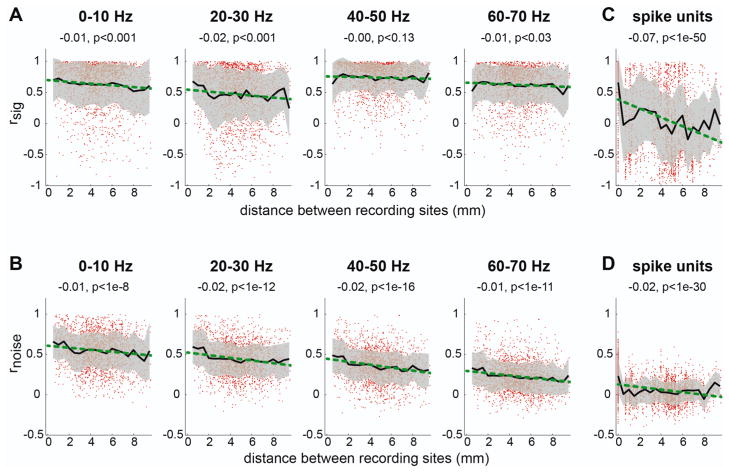
Figure 5.
A. The signal correlation as a function of the distance between LFP channels. Each dot represents a single LFP site. The black line indicates the mean correlation coefficient for a given distance and the gray band indicates the standard deviation. The green line shows the linear regression on the distance and correlation coefficient. The slope of the linear regression and the significance level of the slope are indicated on the top of each plot. B. The same as A but for the noise correlation. C–D. The same as A–B but for spikes.

