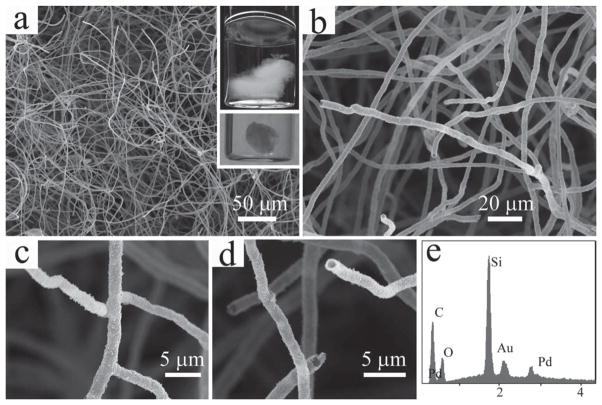
Figure 1.
SEM images of the microfibrous silica scaffold. (a,b) Low and high magnification images of the silica fibers that constitute the 3D scaffold; (c,d) Images showing the branched and hollow nature of the silica fibers; (e) EDS spectrum showing the elemental composition of the scaffold, Au and Pt are from the sputtered coating formed during SEM sample preparation. Inset in (a): photographs of the silica scaffold suspended in water (top) and dried by CPD (bottom, the scaffold was cut to fit the size of the sample holder for the CPD device).

