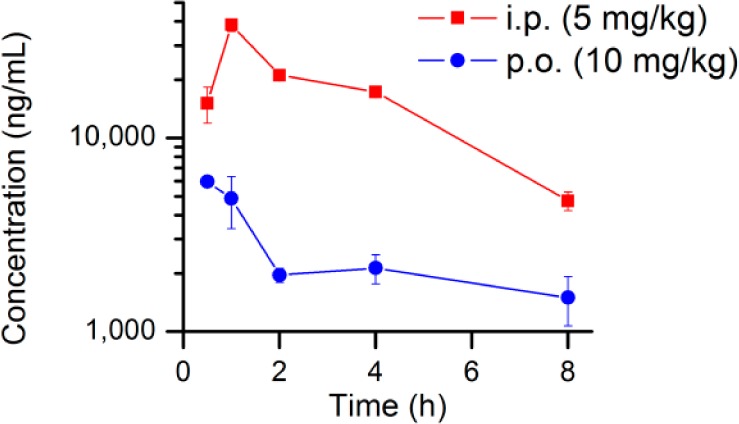
Figure 3.

Pharmacokinetics of TG6-129. The compound was administered to mice by i.p. (5 mg/kg) or p.o. (10 mg/kg) route for pharmacokinetics. Compound concentrations in plasma (ng/mL) were measured at different time points. Data are shown as mean ± SEM (n = 3 mice per time point).
