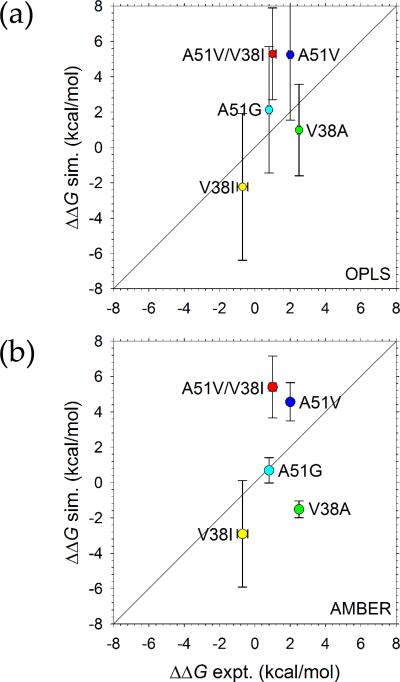
Figure 7. Correlation of the ΔΔG values obtained from MM/GBSA calculations for unrestrained simulations with the experimentally measured ΔΔG values for p38α mutants: A51V, A51G, V38A, V38I and A51V/V38I.
The results of the simulations using the following force fields are shown: (a) OPLS-AA/L; (b) Amber ff99SB-ILDN. Each vertical error bar is obtained using the procedure as described in Methods section. Each horizontal error bar represents the standard deviation of ΔΔG from three independent fluorescence binding experiments. The diagonal line representing perfect correlation is also shown. The linear regressions obtained for OPLS and AMBER force fields are y = 1.43x + 0.68 (R2 = 0.31) and y = 1.04x + 0.09 (R2 = 0.12) respectively.

