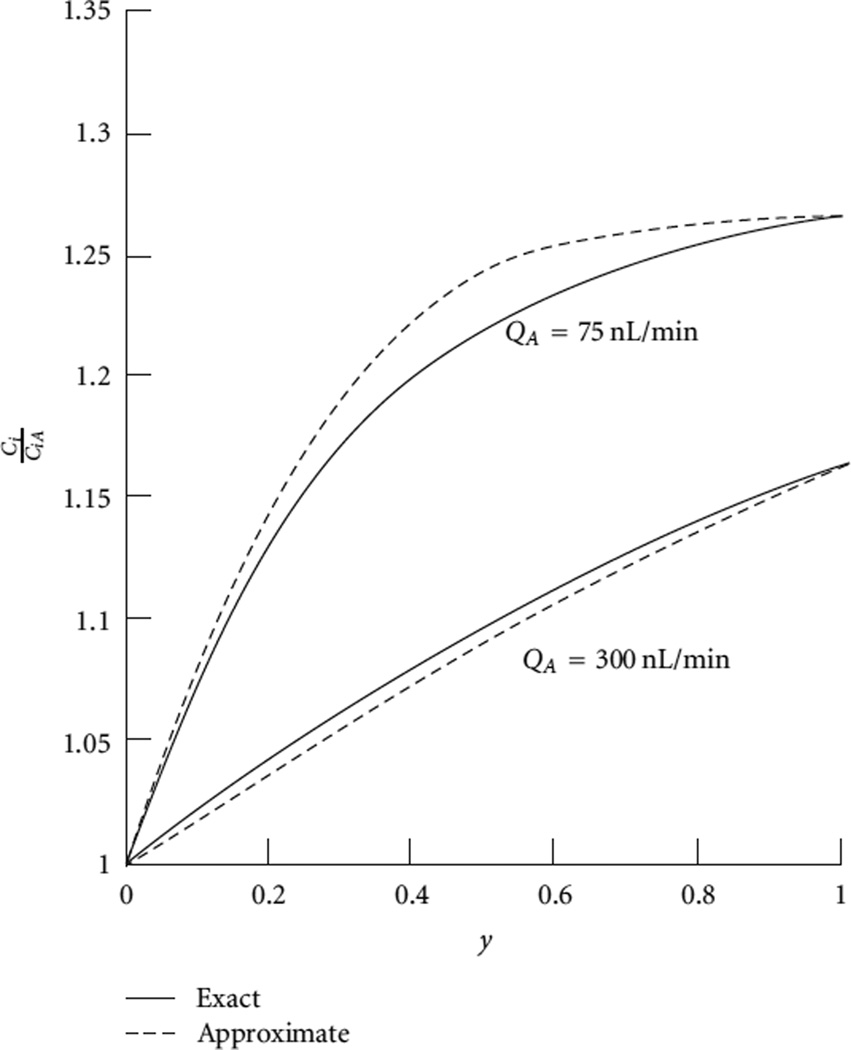
Figure 1.
Plasma solute concentration, relative to its afferent values (CiA), along a glomerular capillary at 2 values of plasma flow rates. The “exact” curves were obtained by solving the mass balance and flux equations of an isoporous model; the “approximate” curves were obtained after applying some simplifying assumptions, so that an analytic solution can be obtained for the solute concentration ratio. Redrawn from [1].

