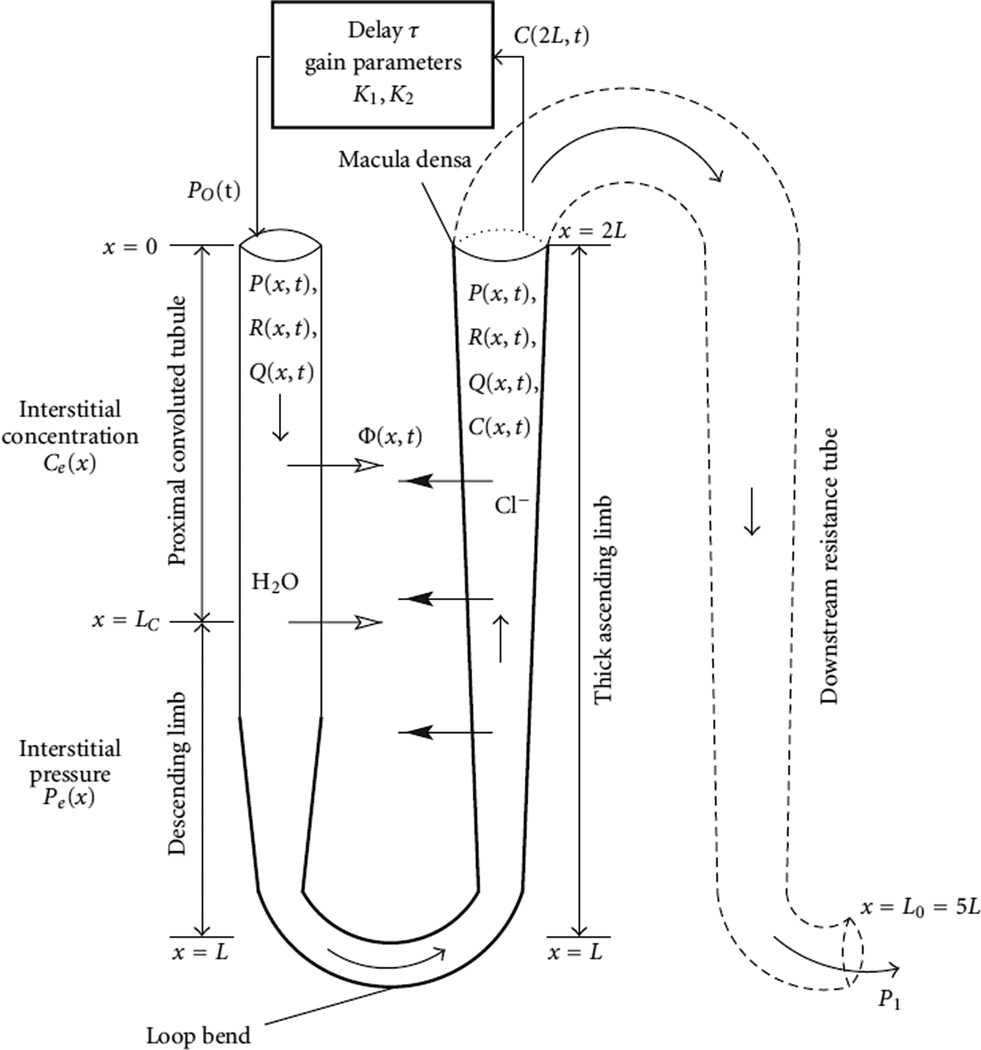
Figure 2.
Schematic representation model TGF system. Hydrodynamic pressure Po(t) = P(0,t) drives flow into loop entrance (x = 0) at time t. Oscillations in pressure result in oscillations in loop pressure P(x, t), flow rate Q(x, t), radius R(x, t), and tubular fluid chloride concentration C(x, t). Reprinted from [3].

