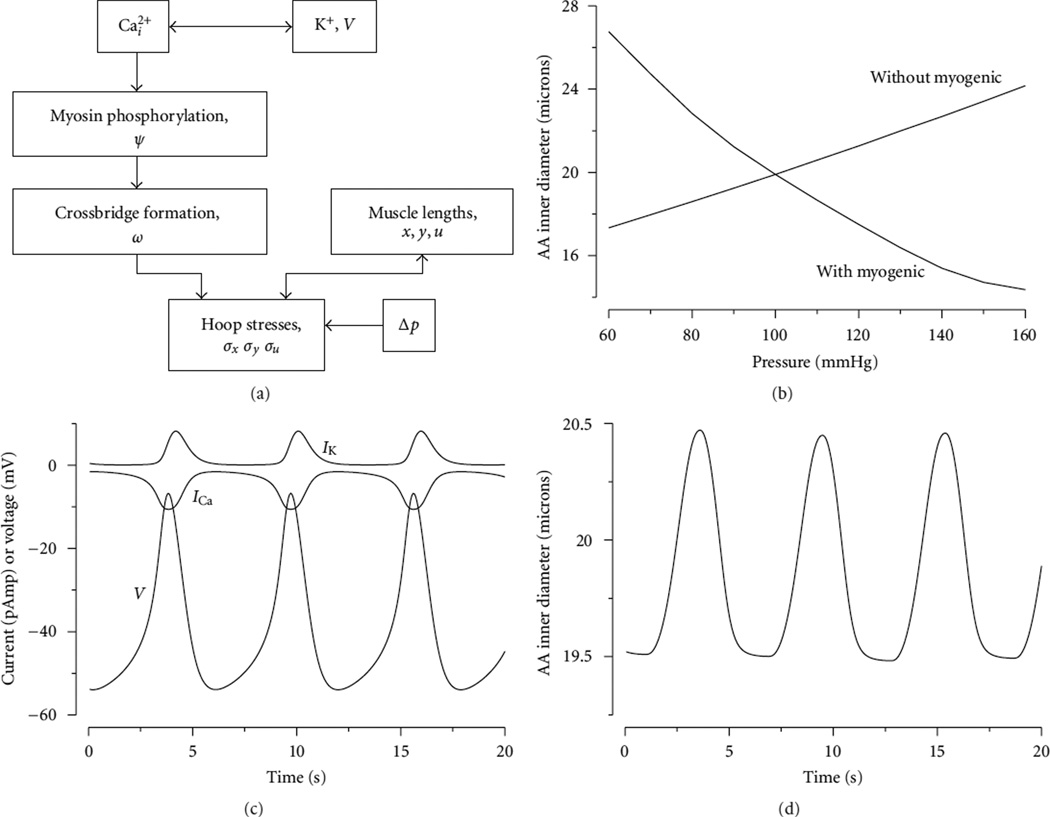
Figure 7.
(a) A flow chart that illustrates the steps by which periodic oscillations in cytosolic calcium concentration give rise to spontaneous vasomotion of the model afferent arteriole in [29, 30]. (b) Average vessel inner diameter as a function of steady-state transmural pressure, with and without a myogenic response. (c) Oscillations in Ca2+ and K+ currents (denoted ICa and Ik, resp.) and membrane potential υ. (d) Oscillations in intracellular arteriolar inner diameter. Reprinted from [29].

