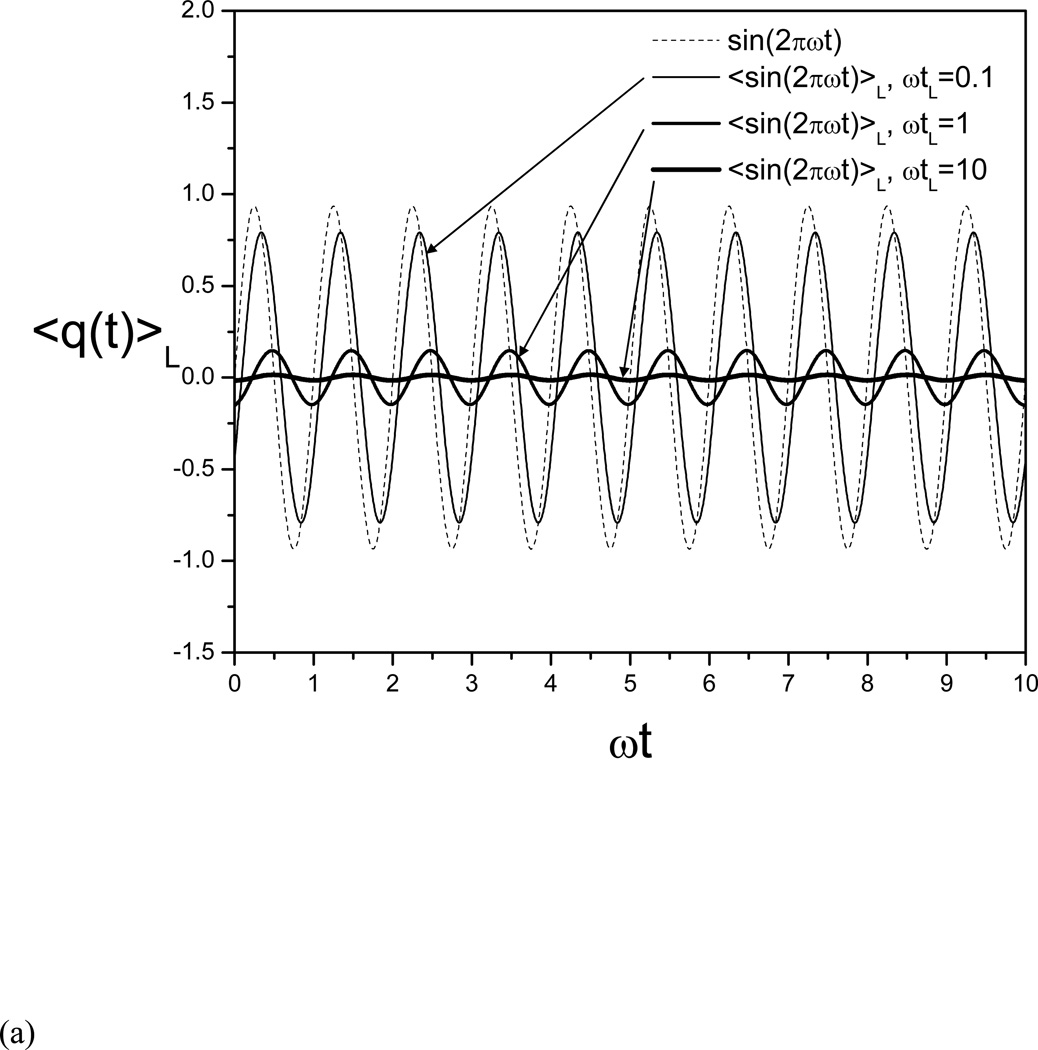
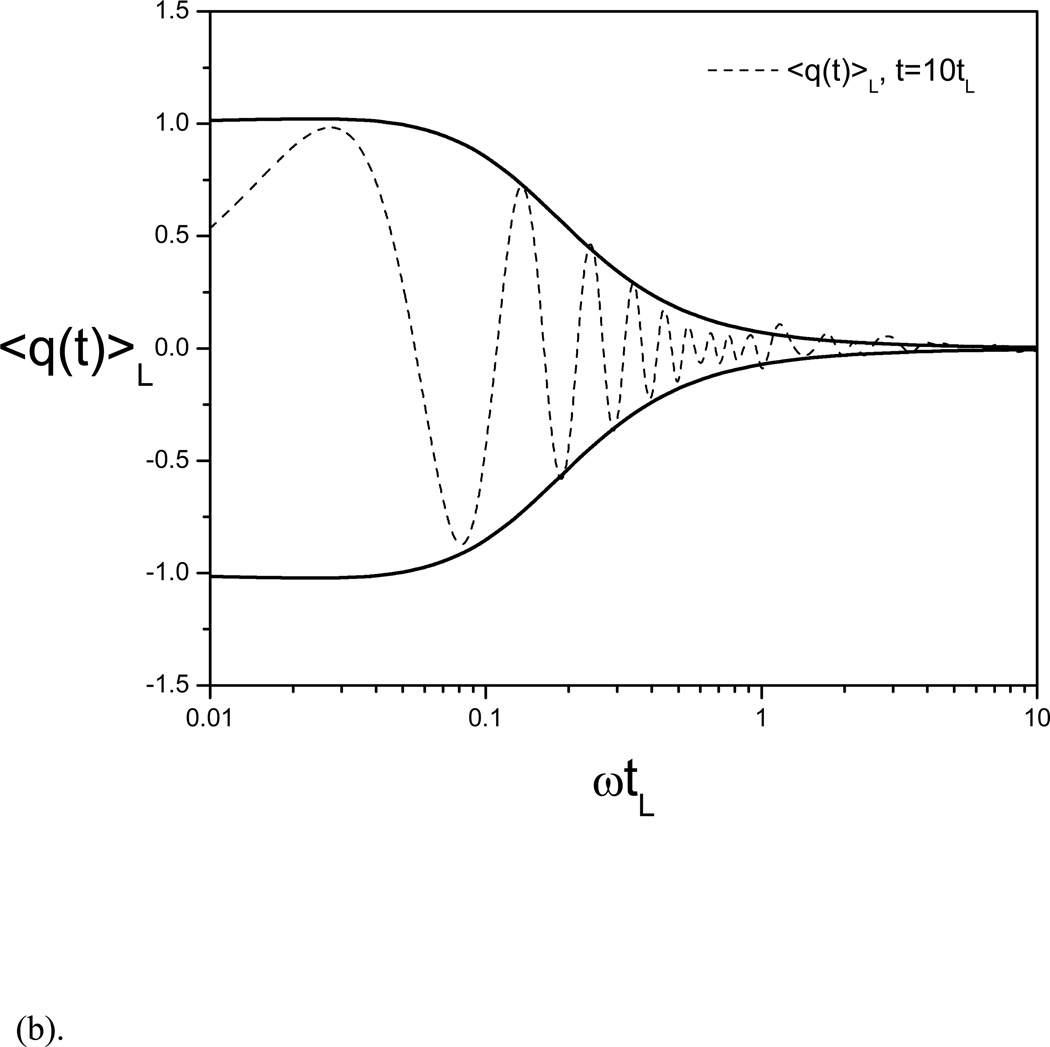
Fig. 1.
(a) The example function, q(t) = sin(2πϖt), and its evolving averages at three local average times: ϖtL = 0.1, 1, and 10.
(b) The evolving average of the example function as a function of the frequency. The envelope curves show the amplitude as a function of ϖtL. At small ϖtL, which corresponds to a low frequency, the amplitude is approaching 1, very similar to that of the example function, while at a large ϖtL, which corresponds to a high frequency, the amplitude approaches 0.


