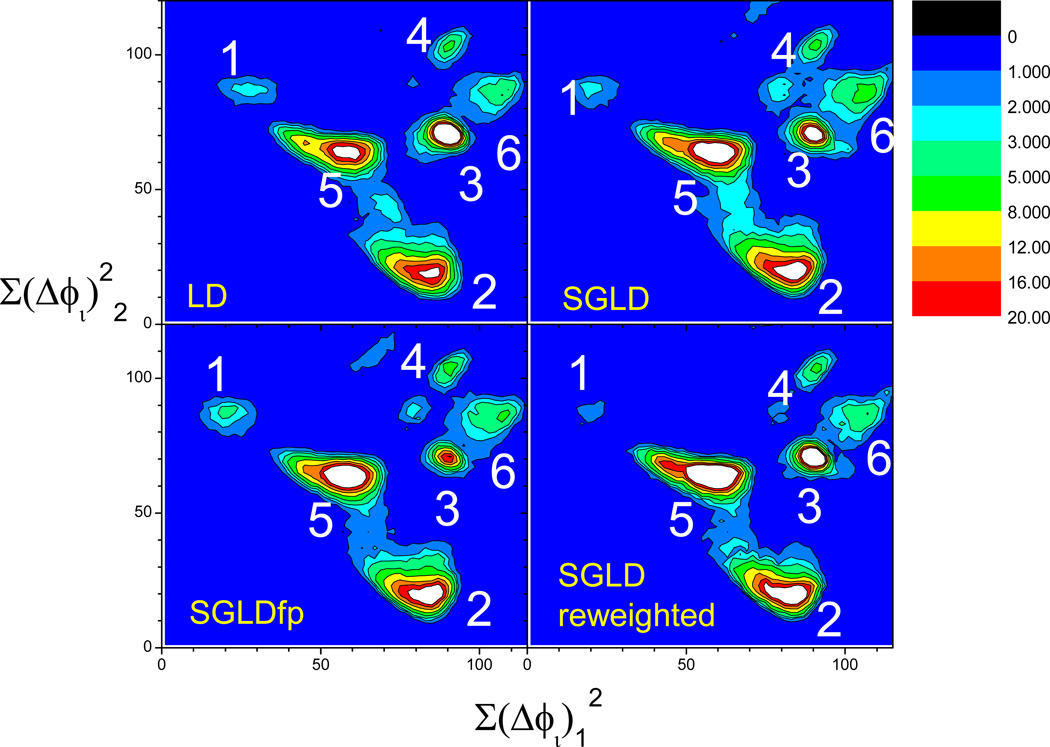
Fig. 18.
Conformational distributions in the LD, SGLD, and SGLDfp simulations. Conformational distances from the center conformations of cluster 1 and 2 are used as x and y coordinates to show the distributions in two dimensions. All simulations are done with γ=1/ps and T=300 K. The guiding factor is λ=0.5 for SGLD and λ=1 for SGLDfp.

