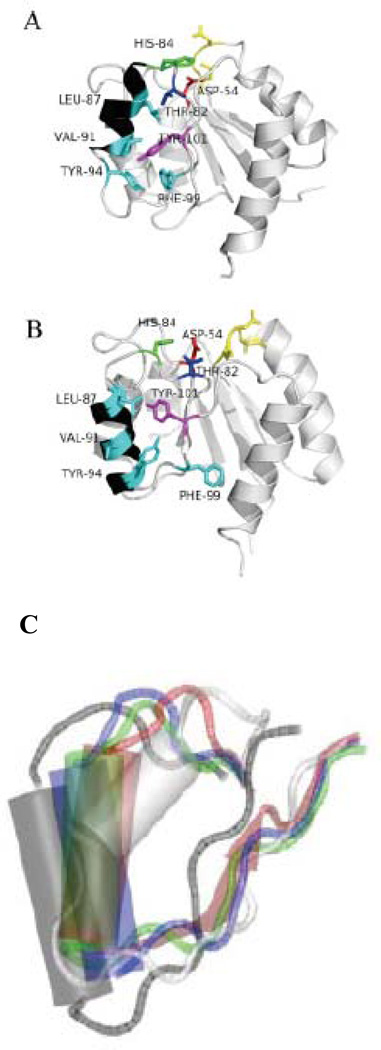
Figure 34.
SGLD simulation of Conformational transitions induced by dephosphorylation in the NtrC protein (Damjanovic et al 2009). A) NMR structure of the inactive form of NtrCr. The key helix 4 is shown in black. B) NMR structure of the active form of NtrCr. C) Conformations of the key helix, 4: dark gray and white are the NMR structures of the phosphorylated and dephosphorylated forms, respectively. In blue is the average structure from the SGLD simulations of the phosphorylated protein. In green and red are the average structures from the SGLD simulations of the dephosphorylated protein with His-84 neutral and protonated, respectively.

