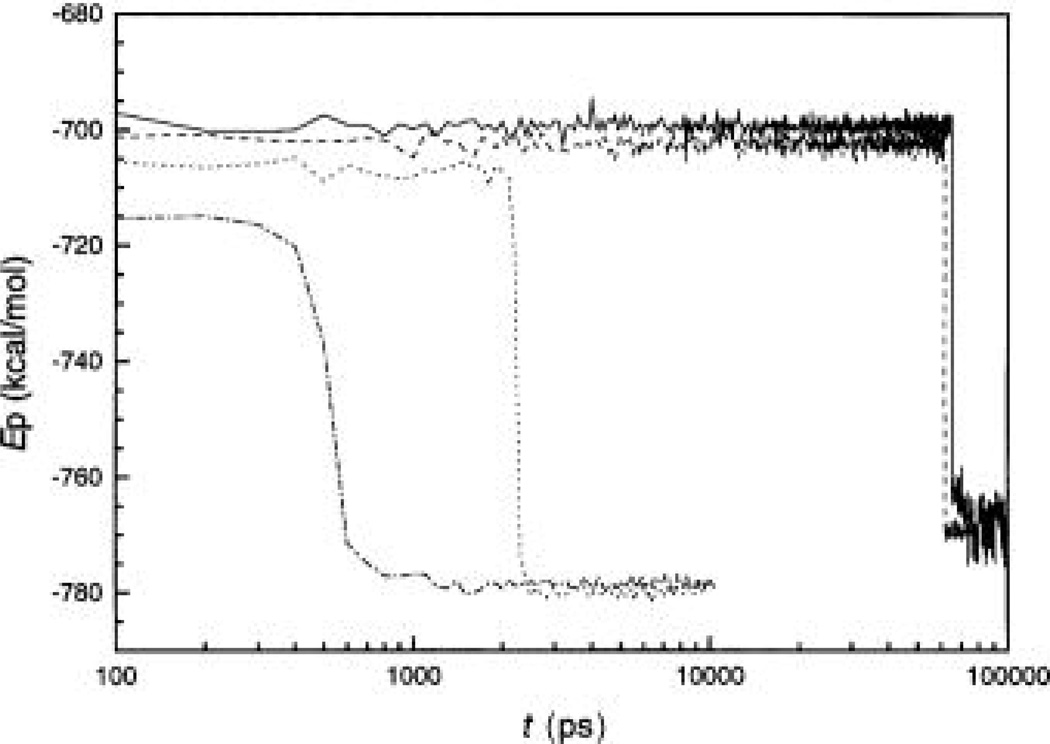
Fig. 39.
The potential energies of the super-cooled argon film system (T* = 0.501) during the crystallization simulations (Wu & Wang 1999). Simulations were T* = 0.501 and with tl = 0.2 ps and different values. The solid line represents the results from a conventional MD simulation. The dashed line, dotted line, and centered lines represent the results in the SGMD simulations with tl = 0.2 ps and = 0.02, 0.05, and 0.1, respectively.

