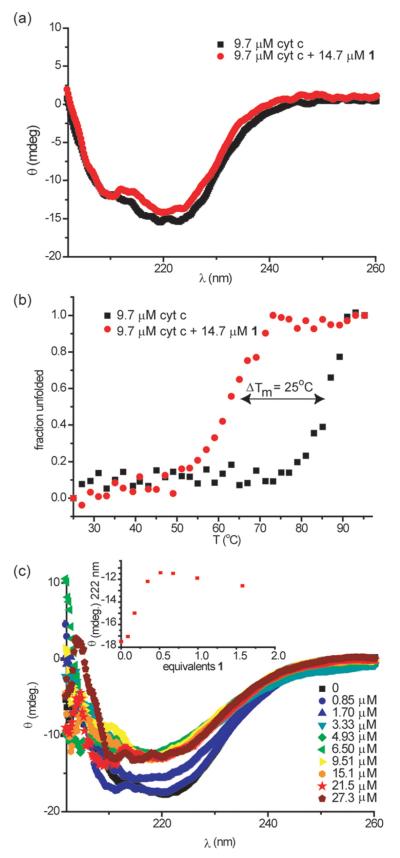
Fig. 2.
Perturbations to secondary structure of cyt c in the presence of 1 (5 mM sodium phosphate, pH 7.4), (a) circular dichroism spectra of cyt c (9.7 μM) in the absence and presence of 1 (14.7 μM) at 25 °C, (b) thermal melting profiles of samples from (a) and (c) circular dichroism spectrum of 9.6 μM cyt c upon titration with 1 at 70 °C (inset: illustrates titration curve).

