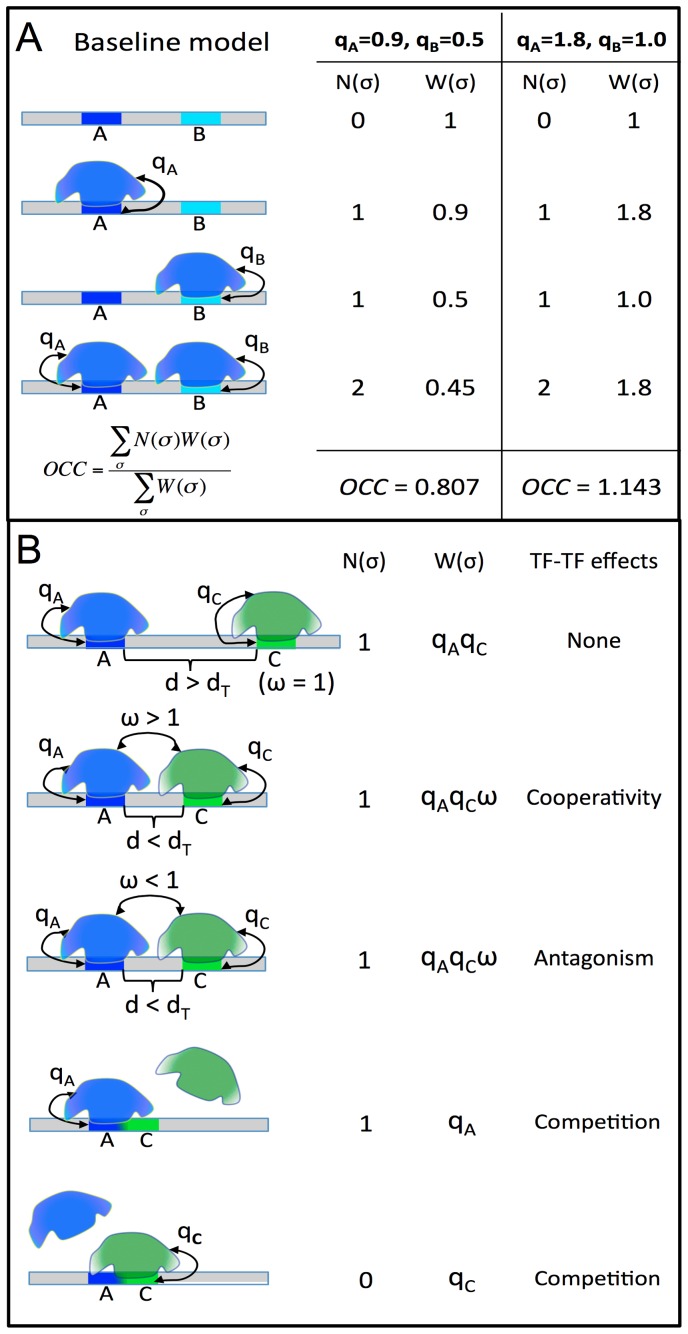
Figure 1. STAP model of TF-DNA binding.
A. Baseline model: only the ChIP'ed (“primary”) TF is considered, and its putative sites in the given sequence are identified. Here, A is a strong site and B is a medium strength site of the TF. Four possible configurations (σ) of A and/or B bound by the TF are enumerated, and for each σ the relative weight W(σ) is calculated as the product of terms (qA, qB) specific to sites occupied in that configuration. The occupancy is then estimated as a weighted average of N(σ), the number of occupied sites in σ. The site-specific terms qA, qB are proportional to TF concentration, so a doubling of concentration will change (qA = 0.9, qB = 0.5) to (qA = 1.8, qB = 1.0), and this will impact the predicted occupancy (OCC = 0.807 to OCC = 1.143), but does not double the prediction, due to saturation effects. B. Interaction between the primary TF (blue) and a secondary TF (green) is modeled by re-defining the relative weight of a configuration where both sites are bound. If the two sites are separated by more than some distance threshold dT, nothing changes, and there is no interaction. If the separation is less than dT, the relative weight of σ is multiplied by an interaction term ω, which can be >1 (for cooperative influence) or <1 (for antagonistic influence). This increases or decreases (respectively) the probability of the joint configuration, and therefore the overall occupancy of the primary TF at site A. Competitive binding at overlapping sites A, C is modeled automatically, since both sites may not be occupied simultaneously in any configuration.

