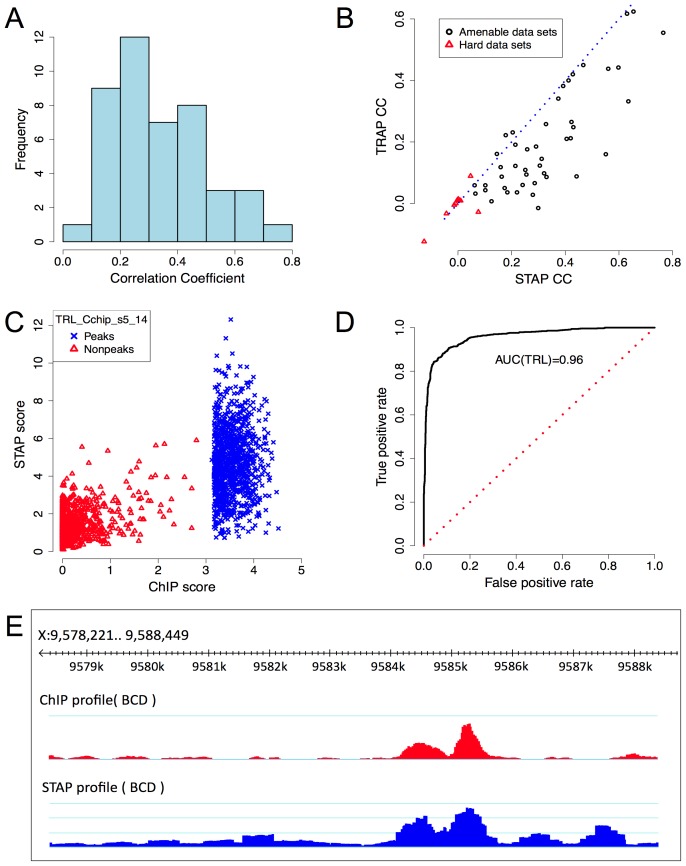
Figure 2. Baseline model performance.
A. Histogram of CC values from Table 1. B. Comparison of CC from STAP-based motif scores to those from TRAP-based motif scores, on all 55 data sets that were examined. Red triangular symbols represent the ten data sets that showed poor CC in all of our models and were thus excluded from reported results. C. ChIP scores and STAP scores for all 2000 segments in the data set that had the best CC overall: “TRL_Cchip_s5_14”. Blue and red points represent the 1000 top ChIP peaks and 1000 randomly selected non-coding segments respectively. D. Receiver Operating Characteristic (ROC) curve for a classifier that uses a threshold on the STAP score to discriminate TF-bound segments from non-bound segments, defined by the top 50% and bottom 50% ChIP scores in the data set “TRL_Cchip_s5_14”. The area under this curve (AUC) is 0.960. E. ChIP (red) and STAP (blue) predicted ChIP score profiles for the transcription factor BCD on a ∼10 Kbp region near gene BTD, at the developmental stage 5. The Pearson's CC at this locus is 0.80.

