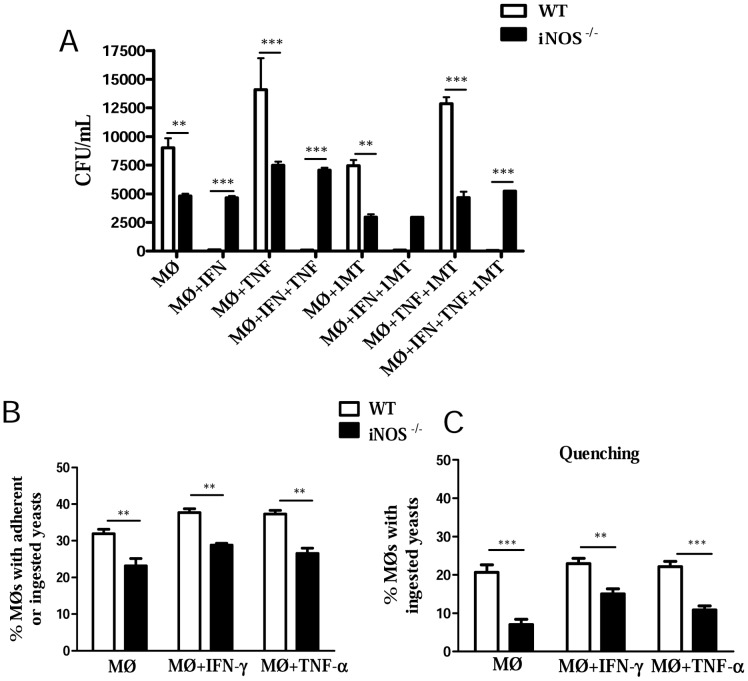
Figure 4. INOS−/− macrophages are refractory to IFN-γ and TNF-α activation and have an impaired phagocytic activity.
(A) For fungicidal assays, peritoneal macrophages from WT and iNOS −/− C57BL/6 mice were cultivated in the presence or absence of recombinant IFN-γ (40 ng/ml), TNF-α (20 ng/ml) or 1-methyl-DL-tryptophan (1 MT, 1 mM), a specific inhibitor of 2,3 indoleamine dioxygenase. Cultures were infected with P. brasiliensis yeasts in a macrophage∶yeast ratio of 12.5∶1. After 48 h, macrophages were lysed, and viable yeasts determined using a CFU assay. All analyzes were done with five wells per condition in three independent experiments. (B) For phagocytic assays, macrophages were infected with heat-inactivated, FITC labeled, P. brasiliensis yeasts at a macrophage∶yeast ratio of 1∶1 for 2 h at 37°C in 5% CO2 to allow fungi adhesion and ingestion. Some macrophage cultures were treated with IFN-γ (40 ng/ml), or TNF-α (20 ng/ml) overnight, before infection. Macrophages were washed, cells detached from plastic, and labeled with anti-F4/80 (APC) antibodies. The cell suspensions were immediately read on a FACScalibur cytometer. All analyzes were done with five wells per condition in three independent experiments. (C) A quenching assay employing a trypan blue solution (TB, 250 µg/mL) was used to distinguish internalized from surface-bound yeasts (FITC- labeled P.brasiliensis particles). Phagocytic assays were performed as above described, and adherent/ingested cells measured using the FL1 and FL4 channels of a FACscalibur cytometer. Cell suspensions were then treated with a TB solution for quenching the green surface-bound fluorescence on macrophages and samples were again analyzed. APC-labeled macrophages were gated, and FL1 and FL3 channels used to discriminate ingested (green fluorescent, FL1) from adherent (red fluorescent, FL3) yeasts. All analyzes were done with five wells per condition in three independent experiments. The bars depict means ± SEM ** (P<0.01) and *** (P<0.001) compared with WT controls.

