
Figure 5. Cell specificity of eQTL SNP-CRE overlap illustrated with DNAse hypersensitivity data.
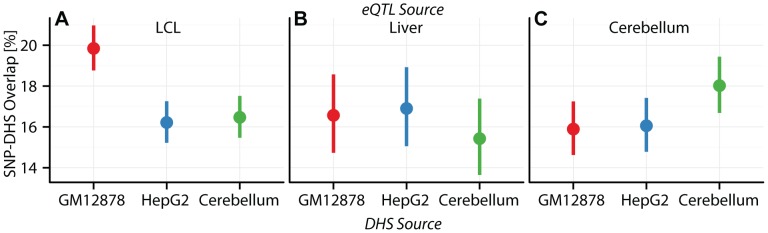
Percentage (dots) and  confidence interval (lines) of (A) CAP_LCL, (B) UChicago_liver, and (C) Harvard_cerebellum eQTL SNPs overlapping DHS sites (y-axis) derived from the LCL cell line GM12878 (red), the HepG2 cell line (blue), and the cerebellum (green).