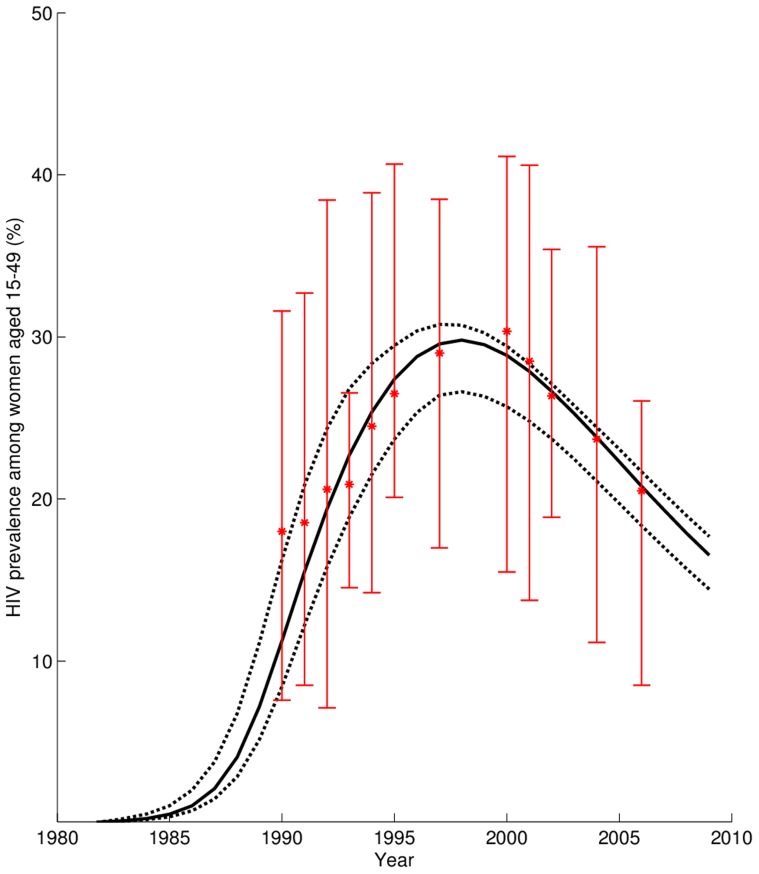
Figure 2. Comparison of model predictions to Zimbabwe antenatal clinic data for non-urban areas [17].
The solid line represents the yearly HIV prevalence as estimated by our model from baseline epidemiological parameters (dotted lines are the 2.5th and 97.5th percentile values). Empirical HIV prevalence is shown as stars (error bars are the 95% confidence intervals). The model was validated from antenatal clinic data not originally used for model parameterization.

