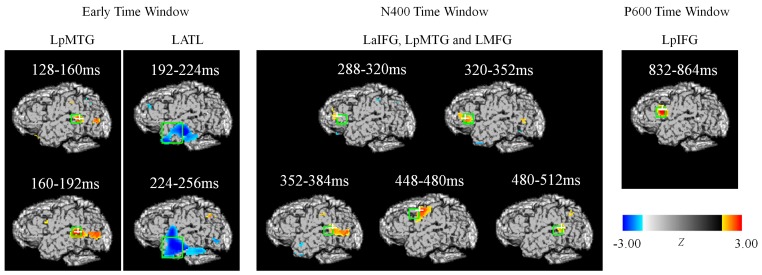
Figure 4. EROS statistical maps of the expectancy effect.
t tests were conducted and converted to Z score maps. The ROI method was used to correct for multiple comparisons. The ROIs (green boxes; 16 mm cubes) were obtained from our previous fMRI data (Huang et al. 2012) with the exception of the LATL ROI (a 35 mm cube). Only the statistically significant results are reported here.

