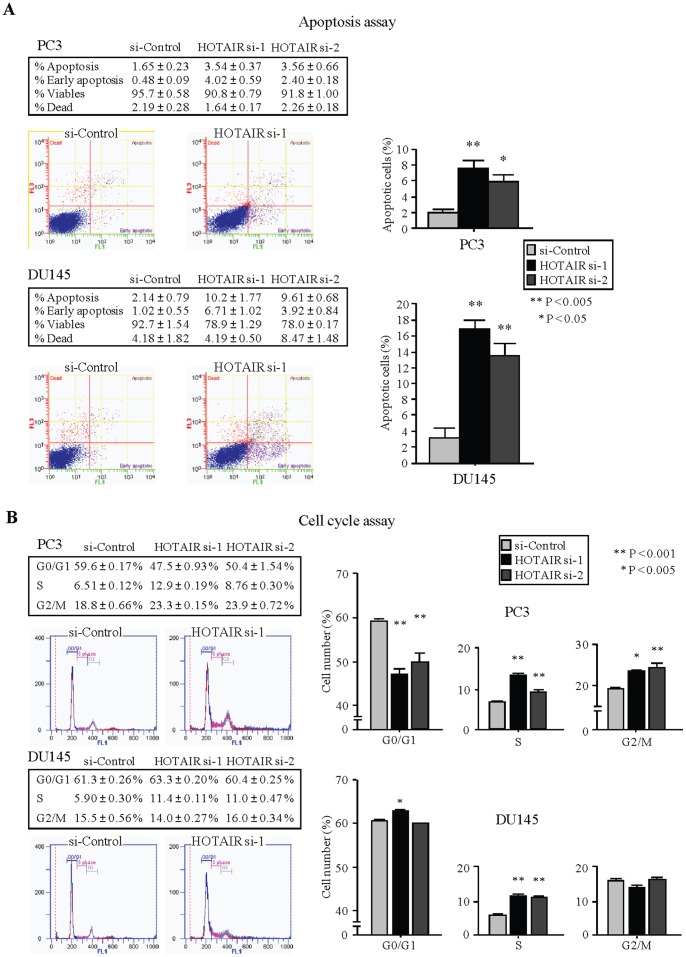
Figure 5. siRNA knockdown of HOTAIR and effect on PCa apoptosis and cell cycle.
(A) Apoptosis assay using flow cytometry. Representative quadrant figures of control and si-HOTAIR treated cells in PC3 (upper) and DU145 (lower) cells. **, P<0.005. *, P<0.05. (B) Typical figures of cell cycle analysis of control, or si-HOTAIR treated cells are shown. The bar chart shown on the right of each figure represents the percentage of the cells in G0/G1, S, or G2/M phase as indicated. **, P<0.001. *, P<0.005.

