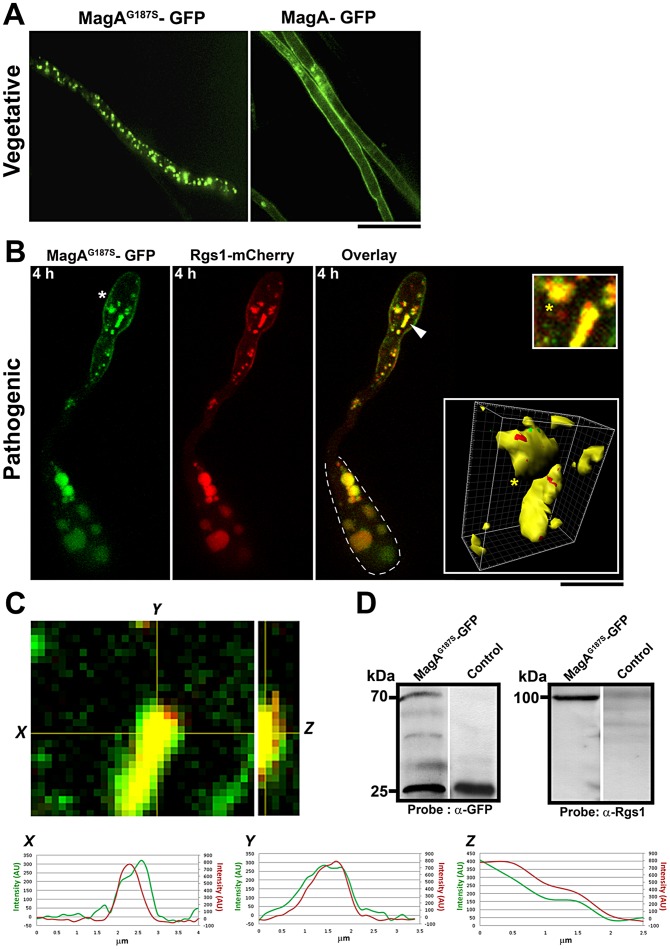
Figure 2. Rgs1 co-localizes with active GαS/MagA during appressorium initiation or early pathogenic development.
(A) Subcellular localization of MagAG187S-GFP and MagA-GFP during vegetative growth. Mycelia from the indicated strains were subjected to confocal microscopy. Single plane images are depicted. Scale bar, 10 µm. (B) Colocalization of constitutive active MagAG187S-GFP (green) and Rgs1-mCherry (red) compartments during the hooking stage. MagAG187S-GFP localizes to cytoplasmic vesicular structures and the plasma membrane (asterisk). The arrow highlights compartments co-populated by MagAG187S-GFP and Rgs1-mCherry and the yellow asterisk highlights the same compartment in the inset and the corresponding 3D surface rendering (panels on the far right). The dotted line demarcates the respective conidium. Images in panel B are maximum intensity Z-projections of six confocal stacks, 0.5 µm each. Scale bar equals 10 µm. (C) Single plane images of merged channels and corresponding orthogonal view of entire stack showing the co-localization of MagAG187S-GFP and Rgs1-mCherry. Representative intensity profiles were obtained for each channel from a single slice along the indicated axes (X and Y) and from the corresponding transverse section of the stack (Z) using Fiji software (D) MagAG187S physically interacts with Rgs1. Western blot analysis from a GFP-trap based pull down experiment showing the specific interaction between MagAG187S and Rgs1 during pathogenic differentiation. After probing for MagAG187S -GFP with α-GFP antibody, the same membrane was stripped and re-probed using α-Rgs1 antibody. Total protein from a cytosolic-GFP strain served as a negative control. Equal concentrations of protein from both the strains were used for the pull down experiment. Scale bar = 10 µm.

