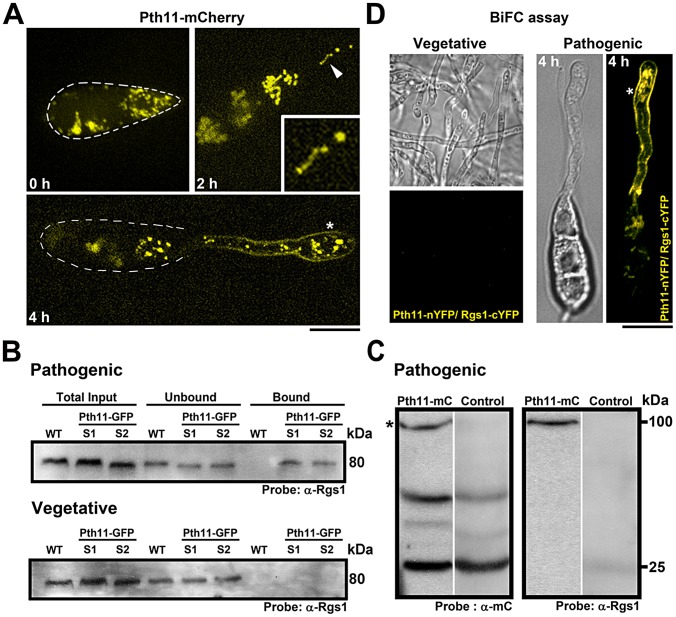
Figure 3. Localization of Pth11 and its interaction with Rgs1 in M. oryzae.
(A) Conidia expressing Pth11-mCherry (pseudocolored yellow) were inoculated on an inductive surface and imaged at the indicated time-points. The inset in the 2 h panel highlights a tubulo-vesicular structure containing Pth11-mCherry. The asterisk depicts the association of Pth11 with the plasma membrane. The dotted line delineates the conidial boundary. Images are maximum intensity Z-projections of five confocal stacks, measuring 0.5 µm each. Scale bar, 10 µm. (B) Pth11 physically interacts with Rgs1. Immunoblots from a pull down experiment depicting the specific interaction between Pth11 and Rgs1 during appressorium initiation. Pth11 physically interacted with Rgs1 during pathogenic differentiation and failed to interact with Rgs1 during vegetative growth. In each case, equal concentrations of protein from both the strains were used for the pull down experiment. Total protein from an untagged wild-type strain served as a negative control in B. S1 and S2 represent two independent Pth11-GFP expressing strains. (C) An RFP-trap experiment depicting the specific interaction between Pth11-mCherry and Rgs1. After probing for Pth11-mCherry with α-mCherry antibody, the same membrane was stripped and re-probed using α-Rgs1 antibody. Total protein from a cytosolic-mCherry expressing strain served as a negative control in C. (D) Confocal microscopy based imaging of a BiFC experiment illustrating the in-vivo interaction between Pth11-nYFP and Rgs1-cYFP in the vegetative mycelium and at 4 h post inoculation on an inductive surface (right; DIC in left panel and YFP in right panel). Asterisk indicates YFP signal and thus likely interaction at the plasma membrane. Images are single plane images captured by a confocal microscope. Scale bar, 10 µm.

