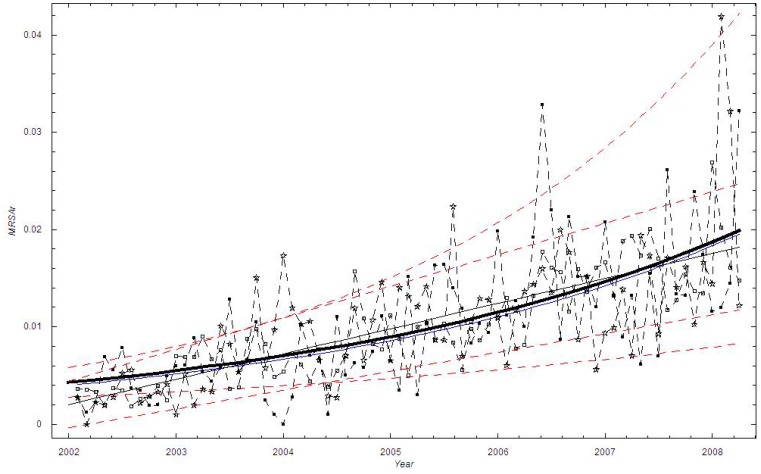
Figure 6. The monthly proportion of MRSA cases in Health Region East: 2002–2008.
Thick black curve:  based on exponential LSF; Blue curve:
  ; Black curve:
  based on linear LSF; Red dashed curve: 95% confidence bounds on exponential and linear LSF curve; ▪: Data, □: Stochastic simulation (run)
  ,☆: Stochastic simulation based on the beta binomial distribution.

