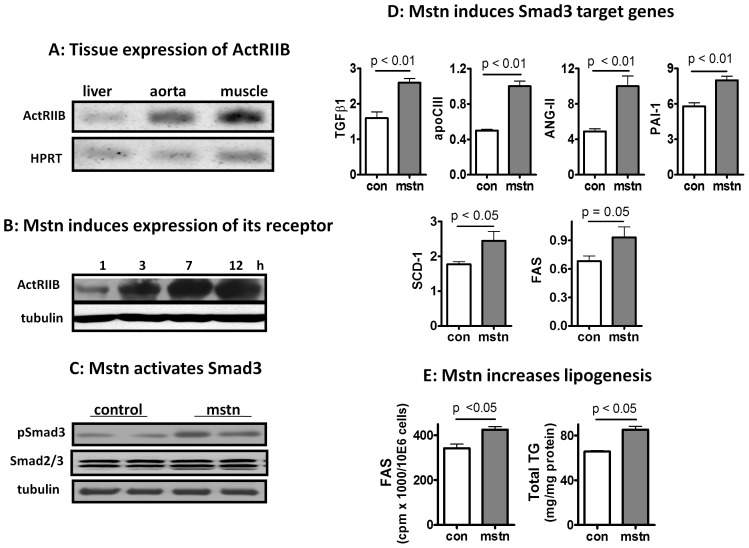
Figure 5. Liver is a direct target of myostatin signaling.
(A) PCR measurement of the expression of myostatin receptor, ActRIIB, in the liver, aorta, and skeletal muscle. (B) Myostatin induces sustained expression of its own receptor in HepG2 cells (mstn, 100 ng/ml, harvested at indicated time points). (C) Myostatin induces Smad3 phosphorylation in HepG2 cells (100 ng/ml, 30 min). All results shown in (A–C) are representative of more than three independent measurements. (D) Myostatin (100 ng/ml, 24 h) induces expression of Smad3 target genes in HepG2 cells (mean ± SEM, n = 4). (E) Myostatin (100 ng/ml) induces lipogenesis and lipid accumulation in HepG2 cells (means ± SEM, n = 4).

