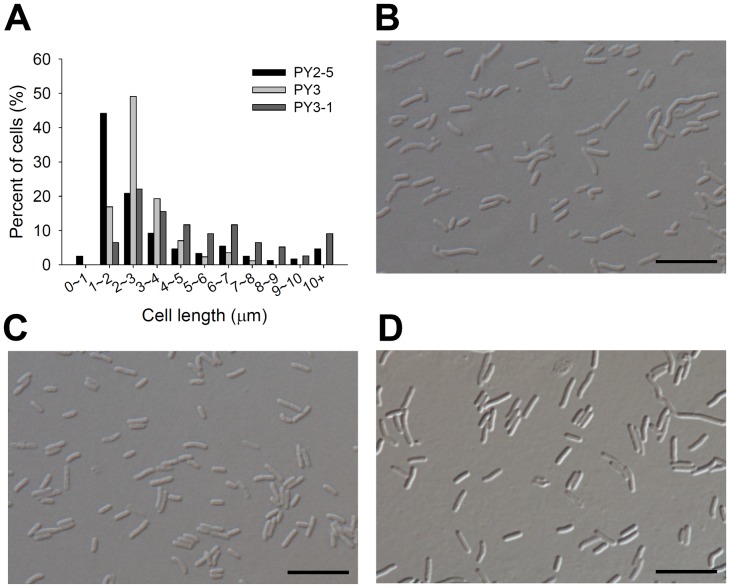
Figure 8. The effects of MinCHp and MinCEc proteins on cell length distribution of H. pylori.
(A) Cell length distributions of the PY2-5, PY3, and PY3-1. (B to D) Differential interference contrast (DIC) microscopic images of the three strains shown in panel A to demonstrate the morphology. (B) PY2-5; (C) PY3; (D) PY3-1. Scale bars, 10 µm.

