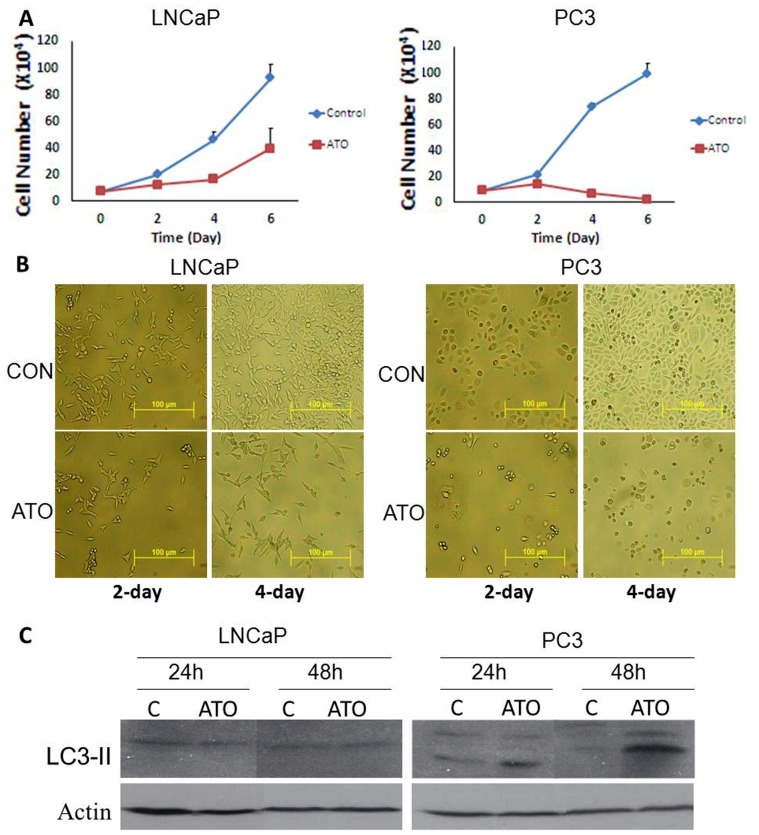
Figure 1. Effect of ATO on cell proliferation, morphology and autophagy marker LC3-II expression.
(A) LNCaP and PC3 cells were seeded in 6 well plates (36000 cells/well) and incubated overnight and then treated with DMSO (control) or 10 µM ATO for 2, 4 and 6 days. Cell numbers are expressed as Mean ± SD, n = 3. (B) Microscopy of LNCaP and PC3 cells after treatment with10 µM ATO for 2 and 4 days. C: LNCaP and PC3 cells were treated with 5 µM ATO for 24 and 48 h, cell lysates were collected for LC3-II expression analysis using western blot. ATO induced LC3-II expression only in PC3 cells.

