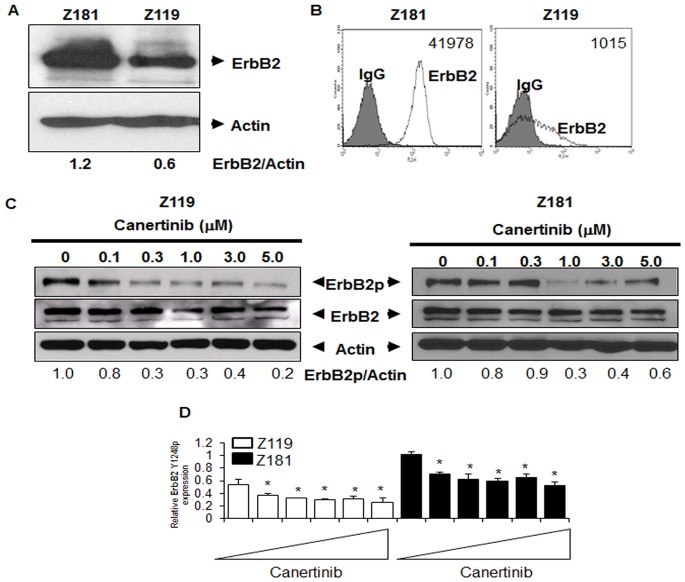
Figure 2. ErbB2 protein expression and activation in Ph+ALL cell lines.
(A) Two established human Ph+ALL cell lines, Z181 and Z119, were lysed and then subjected to SDS-PAGE followed by Western blotting for ErbB2 and actin. Blots are representative of at least three independent experiments. Densitometry was performed using ImageJ (National Institutes of Health). (B) Cell lines were stained with murine PE-conjugated anti-human ErbB2 monoclonal antibody and assessed by flow cytometry; isotype control staining (grey) and anti-ErbB2 staining (white). Cell surface quantification was performed as described in Materials and Methods. Numbers indicate the average number of molecules of ErbB2 per cell. (C) Protein lysates were collected from cells treated with the indicated doses of canertinib for 18 hours. Samples were subjected to SDS-PAGE followed by Western blotting for ErbB2 Y1248p (ErbB2p), total ErbB2 (ErbB2), or actin. Blots are representative of at least three experiments. Densitometry was performed using ImageJ software and normalized to actin. (D) RPPA analyses were performed utilizing ErbB2p antibody. Bars represent the means of three individual experiments. Triangles indicate drug concentrations of 0–5 µM. *p<0.05 compared to untreated.

