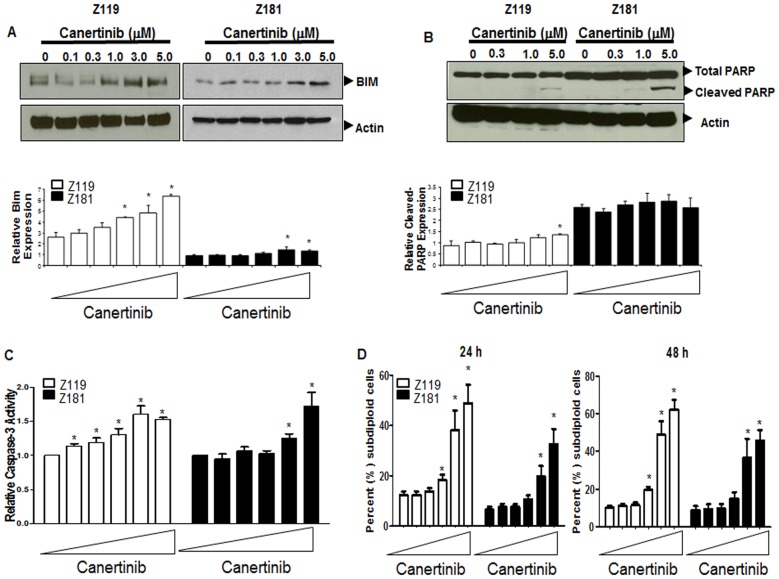
Figure 5. Apoptosis of ErbB2+Ph+ALL cell lines is induced by canertinib.
(A and B, upper panels) Z119 and Z181 cells were treated with canertinib for 18 hours and lysates were subjected to SDS-PAGE followed by immunoblotting with the indicated antibodies. (A and B, lower panels) Protein expression values from RPPA analyses were quantified, and expression relative to the mean graphed. Triangles indicate drug doses of 0–5 µM. *p<0.05 compared to untreated. (C) Caspase-3 activity was assayed after 18 hours of treatment with canertinib using DEVD-AMC fluorogenic substrate. Bars indicate the mean and standard deviation of three independent experiments. *p<0.05 compared to untreated. (D) After treatment with canertinib for either 24 (left panel) or 48 (right panel) hours, cells were stained with PI, and the subdiploid population was quantified by flow cytometry. Bars indicate the mean and standard deviation of at least three independent experiments. *p<0.05. Triangles indicate 0–5 µM doses.

