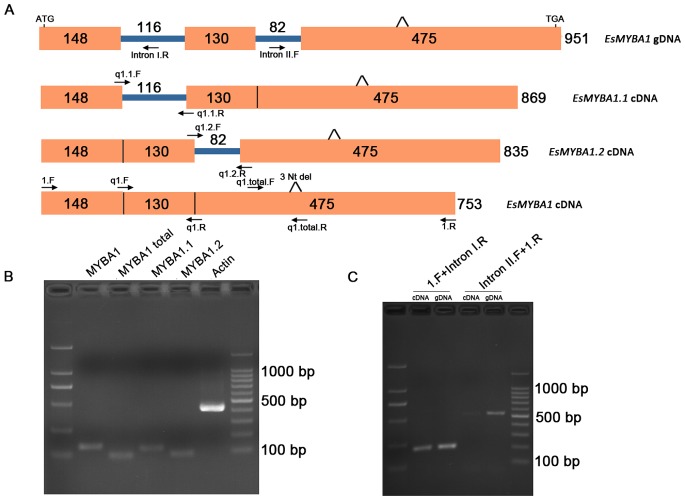
Figure 2. Genomic structure and alternative splicing analysis of EsMYBA1 gene.
(A) Schematic diagram of genomic structure and three different transcripts resulting from alternative splicing of EsMYBA1 gene. The exons are shown as blocks and the introns as lines. The primers used in this study are shown as arrows and listed in the Table S1 in File S1. The three nucleotide deletion (Nt del) in both cDNA and gDNA sequences are indicated. Numbers refer to the fragment length from primer 1.F to 1.R used for the full-length EsMYBA1 cDNA amplification. (B) Representative gel image of the amplicons corresponding to the different transcripts of EsMYBA1 gene using the different transcript-specific primers and cDNA template from Epimedium leaves. Four amplicons, referring to the EsMYBA1, EsMYBA1.1 EsMYBA1.2 and the specific fragment shared by these three transcripts (named as “EsMYBA1 total”) are indicated, while the Actin gene of Epimedium is also indicated as a positive control. (C) Representative gel image of two amplicons amplification for confirming the alternative splicing of EsMYBA1 gene. Two pairs of primers compassing the part intron I and intron II fragments, respectively, are used to amplify the two different fragments from both cDNA and gDNA templates. Each fragment from both cDNA and gDNA shows the same band size.

