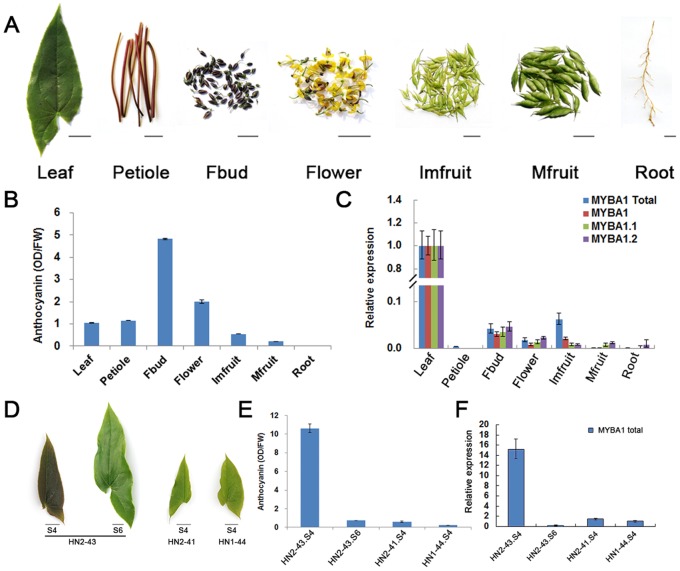
Figure 3. Quantitative RT-PCR analysis of EsMYBA1 and total anthocyanin content measurement in various tissues of Epimedium.
Photos of seven tissues from E. sagittatum, including leaf, petiole, flower bud (Fbud), flower, immature fruit (Imfruit), mature fruit (Mfruit) and root tissues (A), and four leaf samples from three plantlets of two populations of E.sagittatum at the two developmental stages (S4, fully opened young leaf with one-half size of mature leaf and S6, slightly leathered mature leaf) (D), bar = 1 cm. Total anthocyanin content from seven different tissues (B) and four leaf samples (E) above was measured. Each column represents the mean value with error bar indicating SD from three technical replicates for each sample. Quantitative RT-PCR analysis of different transcripts from EsMYBA1 gene in seven tissues (C) and of “EsMYBA1 total” in four leaf samples (F) was carried out. Four transcripts resulting from the alternative splicing of EsMYBA1 gene, including EsMYBA1, EsMYBA1.1, EsMYBA1.2 and “EsMYBA1 total” (fragment shared by three transcripts, for detail explanation see Figure 2) were selected, and the Actin gene was used as an internal control. All primers used for qPCR analysis were listed in the Table S1 in File S1. The comparative Ct method was used to determine the relative level of gene expression. The column shows the average value with SD bar from three technical replicates.

