
Figure 2. Azide binding to Mt-trHbN(III) in the absence and presence of isoniazid.
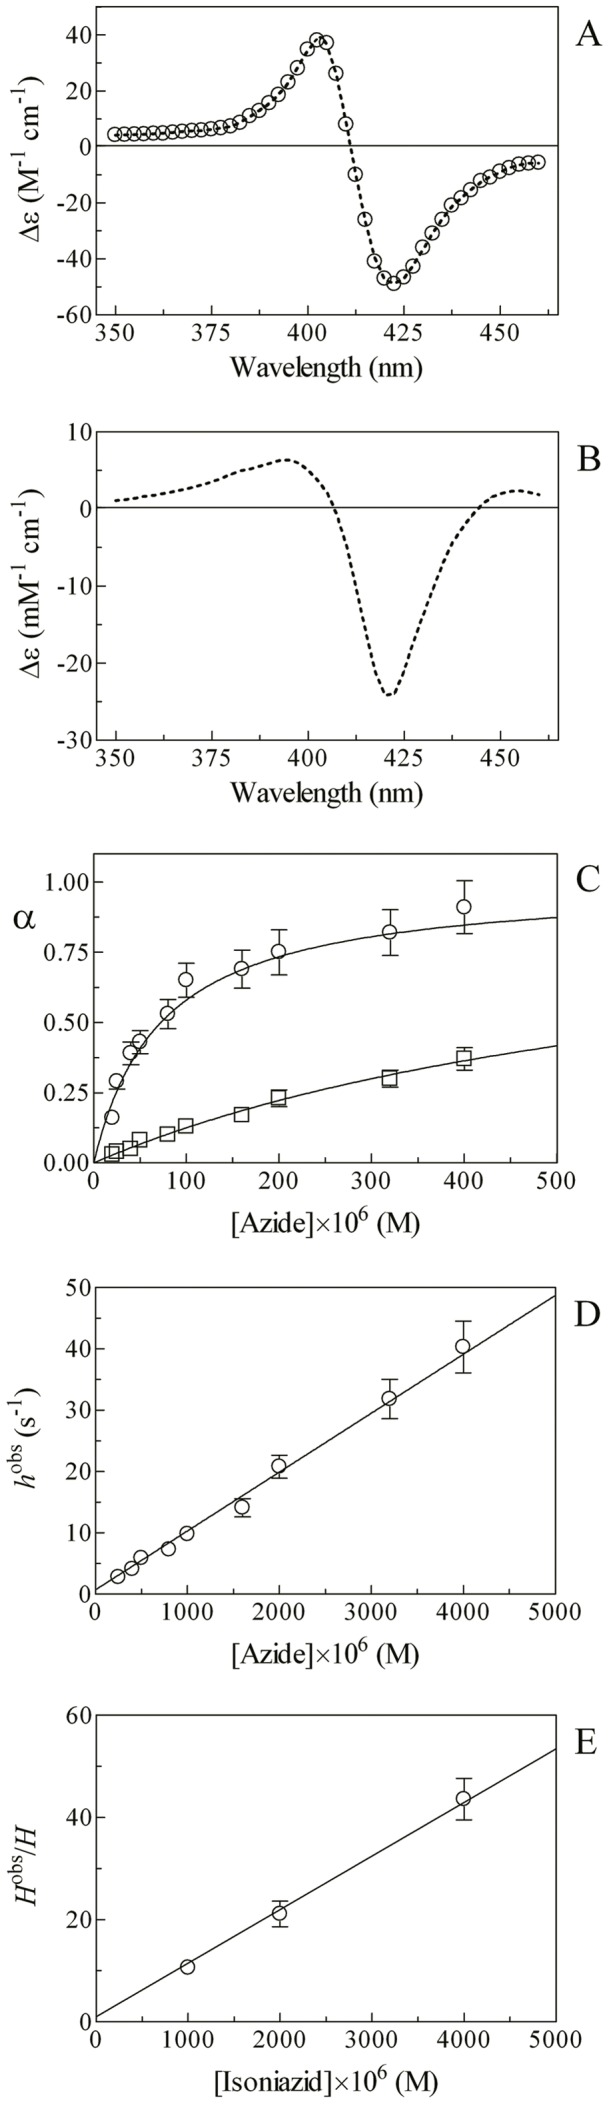
(A) Difference static and kinetic absorbance spectrum of Mt-trHbN(III) minus Mt-trHbN(III)-azide (dotted line and open circles, respectively). (B) Difference static absorbance spectrum of Mt-trHbN(III)-isoniazid minus Mt-trHbN(III)-azide. (C) Ligand-binding isotherms for azide binding to Mt-trHbN(III) in the absence (circles) and presence (squares) of isoniazid. The analysis of data according to Equation 4 allowed the determination of H = (7.3±0.8)×10−5 M and H obs = (7.0±0.8)×10−4 M in the absence (circles) and presence (squares) of isoniazid. (D) Dependence of the pseudo-first-order rate-constant h obs for azide binding to Mt-trHbN(III) on the ligand concentration. The analysis of data according to Equation 6 allowed the determination of h on = (9.6±1.1)×103 M−1 s−1 and h off = (7.1±0.8)×10−1 s−1. (E) Dependence of the H obs/H ratio on the isoniazid concentration. The analysis of data according to Equation 7 allowed the determination of K = (9.5±0.9)×10−5 M. The protein concentration was 4.0×10⁻⁶ M (panels A, B, and C) and 2.0×10⁻⁶ M (panel D). The isoniazid concentration was 4.0×10⁻³ M (panels A and B) and 1.0×10⁻³ M (panel C). Where not shown, the standard deviation is smaller than the symbol. All data were obtained at pH 7.0 and 20.0°C. For details, see text.