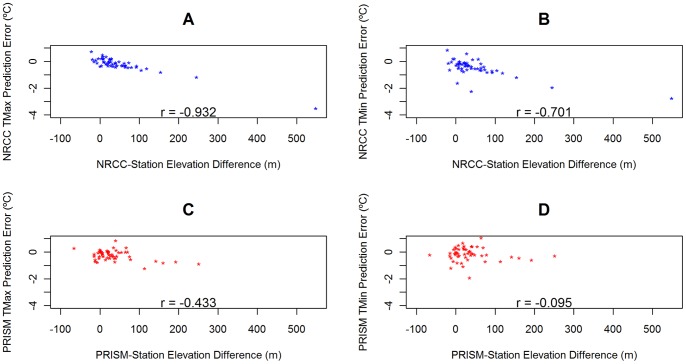
Figure 6. Relationships between GHC annual mean prediction error and DEM error.
Plots for relationships between differences between DEM elevation estimates and station elevation (x-axis) and a) NRCC TMax Mean, b) NRCC TMin Mean, c) PRISM TMax Mean, and d) PRISM TMin Mean prediction errors. Plots shown all have Pearson’s correlation coefficients (r) labeled at the bottom of each plot.

